Tag: mapping
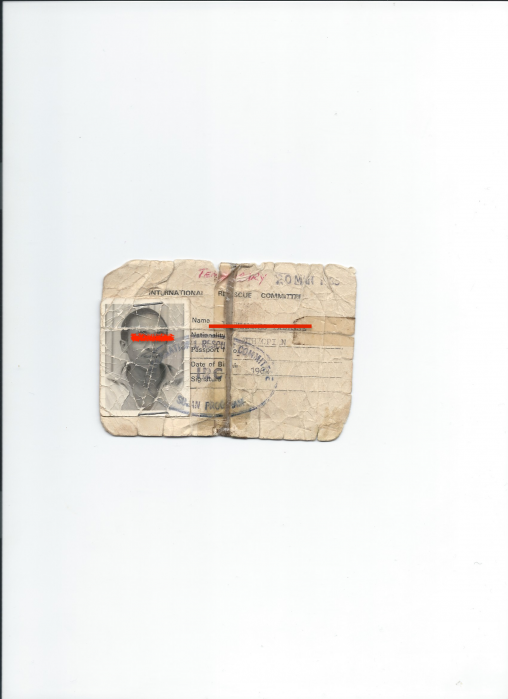
This data storytelling project investigates the story of three childhood best-friends and former refugees who who lost each other across continents for nearly four decades before reuniting in 2018.
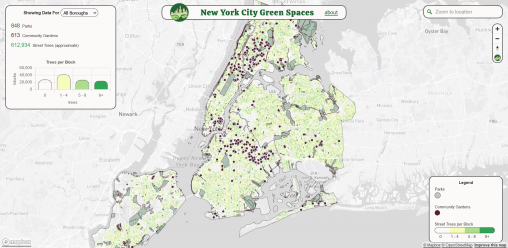
Marc Molta The New York City Green Spaces web map connects people to publicly accessible green spaces in New York City. Community Gardens, selected Parks Properties, and Block-level…
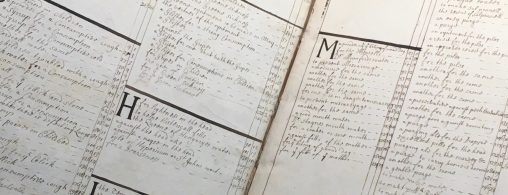
Using Interactive Maps to Visualize the Relationship between Food and Empire in the Early Modern Era
This engaging digital exhibit combines custom interactive maps with 17th-century cookbooks to communicate the concrete relationship between food and empire that fueled the rapid expansion of global trade, expansion, exploration, and extraction in the early modern era.
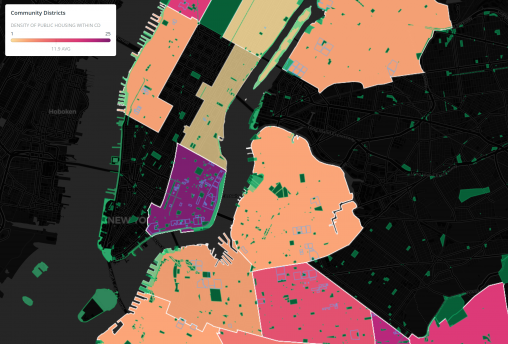
This map, made in Carto, is an exploration of the relationship between public space and public housing in NYC. By examining the area and frequency of these dynamics within Community Districts, I illustrate the stark differences in NYC’s realized development priorities, highlighting impact on a hyperlocal scale in novel ways.
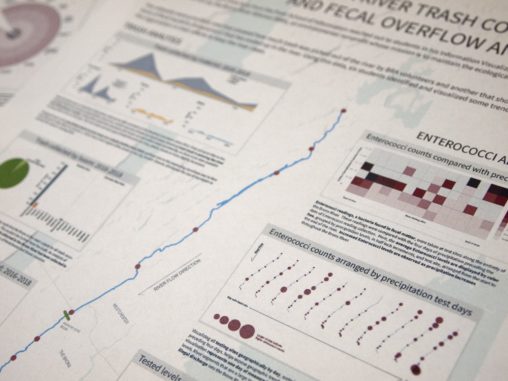
Six students in Professor Sula’s Information Visualization class analyzed two datasets concerning the environmental quality of the Bronx River provided by the Bronx River Alliance (BxRA). A large-scale poster was created for the BxRA to display in their new headquarters.
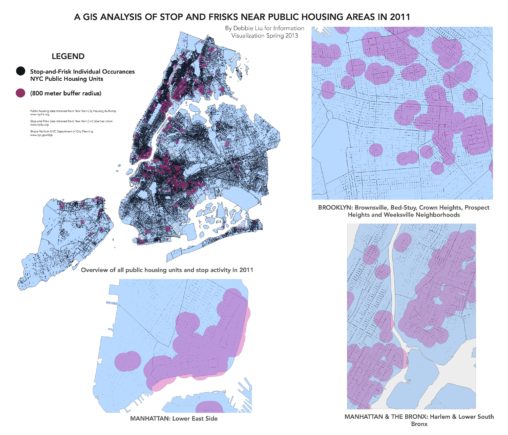
This mapping project examines stop and frisk data and public housing data.
In this talk we will demonstrate a map illustrating the path traveled by the protagonist of the novel The Dewey Decimal System by Nathan Larson. We will discuss how interactive mapping tools can be used to enhance literacy.
Students mapped a work of fiction by charting one character’s movements through New York City. The result is a resource that enhances a reader’s experience and gestures toward ways in which stories may become truly intertextual. In this project, our group created an interactive map using Prezi for the book It’s Like This, Cat written by Emily Cheney Neville which is about the friendship between 14-year-old Dave Mitchell and his college-aged friend Tom, and the cat that brought them together. Among other things, this map includes sites that Dave and Tom visited such as: the 59th Street Bridge, the New York Public Library, and Coney Island with interactive features including embedded videos, discussion questions, and activities geared to middle-grades students.