Category: 2026Page 4 of 4
This project combines an independent study mapping global seafloor geomorphology, extractive industry, and ocean governance with a spatial statistical analysis of the North Atlantic — testing whether marine…
The National Gentrification Intensity Map is an interactive web dashboard visualizing tract-level gentrification intensity across US communities. It supports exploration through two time periods (1970–2020 and 1990–2020), filtering…
How do we help people experience art today? And what shaped the art they’re looking at? As a MoMA Digital Fellow, I was drawn to the discovery aspect…
This presentation will go through the final project produced during my fellowship at the Museum of Modern Art Library. I will discuss my duties overall, as well as…
Inspired by the American Woodcock buzz in Bryant Park, this Augmented Reality experience investigates how to make ecological information more accessible. By visualizing birds and their journeys within…
Boojie is a haunted smart home pomodoro clock.
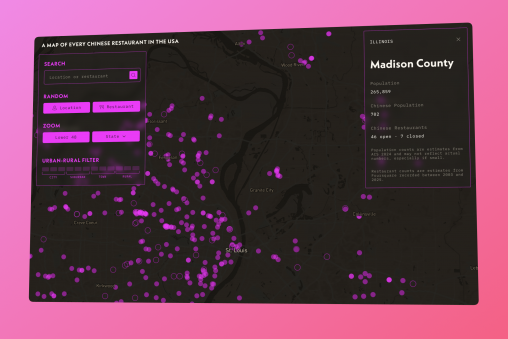
Chinese food is ubiquitous in the US. At the county level, 76% have at least one Chinese restaurant, but only 1.6% of the population is Chinese and are…
Mapping the Ocean: A Map Series of Seafloor Geomorphology, Extractive Industry, and Ocean Governance
This project combines an independent study mapping global seafloor geomorphology, extractive industry, and ocean governance with a spatial statistical analysis of the North Atlantic — testing whether marine…
The MET Origins is an interactive 3D web experience that maps over 6,000 artifacts from The Metropolitan Museum of Art in New York, to their geographic places of…
Socially vulnerable communities suffer more from extreme heat and air pollution—two major environmental risk factors for cardiovascular and respiratory illnesses. This project aims to create a risk index…
Namma ORRoville is a speculative design project set along Bangalore’s Outer Ring Road in 2060, where traffic shaped the urban fabric, western dominant tech absorbed it, and an…
During my time as a Digital Media Fellow at The Museum of the City of New York, I completed a Bloomberg Connects audio project for their In +…
This is my final project for INFO698: Practicum, about my internship at The Center for Fiction (CFF). I weeded a large portion of their library collection, using my…
Library of Things (LoT) collections are increasingly popular in libraries, yet they remain underresearched and unstandardized. This project examines LoT collections across 14 public libraries to analyze purchasing…
The Invisible Script: Etiquette and Behavior in the Victorian Era examines how etiquette functioned as a system of social regulation within nineteenth-century upper-class society in the United States…
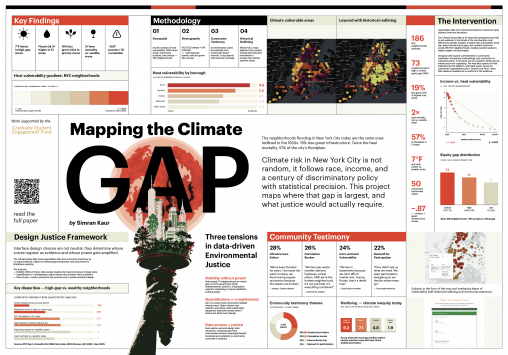
Visualizing environmental justice through interactive data to empower communities and guide equitable climate investments. Built during a fellowship at Femmecubator with funding from Pratt Graduate Student Enhancement Fund.