Project Background
The rate at which Earth is warming means dire consequences for ecosystems and forced plant migration for species that manage to survive. This project explores datasets on urban forest threats, climate change pressures, and a treemap of the conterminous United States to visualize different effects of climate change on tree communities.
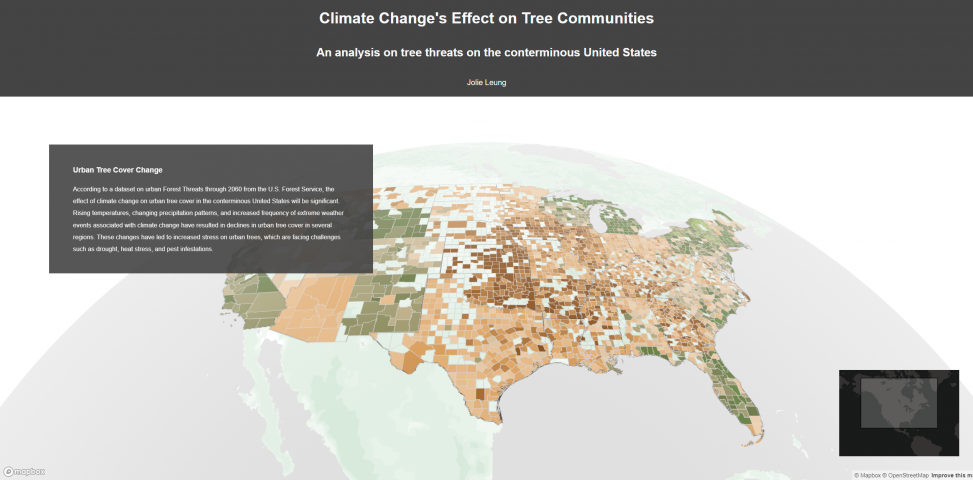
This storytelling map, created using Mapbox GL JS, visualizes different climate change metrics against tree data on the conterminous United States. Urban tree cover change, temperature change, absolute precipitation, and aridity change are all predicted through 2060 (Nowak et. al.) and indexed on a scale between -1 (less risk) to 1, with 0 being no change. It is important to note that this dataset measures riskiness of change in each metric, but does not necessarily outline how the metric is changing. However, when analyzing these metrics in relation to tree communities, a stable environment is preferred, so any radical change could potentially be detrimental if a tree is unable to adapt.
Skills/Technologies Used
Python, Jupyter Notebook, ArcGIS Pro, QGIS, Mapbox Studio, Mapbox GL JS, Plotly, UX Research
Main Datasets
Matthews, Stephen N.; Iverson, Louis R.; Peters, Matthew P.; Prasad, Anantha M. 2019. Climate change pressures for the conterminous United States: plant hardiness zones, heat zones, growing degree days, and cumulative drought severity. Fort Collins, CO: Forest Service Research Data Archive. https://doi.org/10.2737/RDS-2019-0001
Nowak, David J.; Greenfield, Eric J.; Ellis, Alexis. 2022. Conterminous United States urban forest threats to 2060. Fort Collins, CO: Forest Service Research Data Archive. https://doi.org/10.2737/RDS-2021-0068
Riley, Karin L.; Grenfell, Isaac C.; Finney, Mark A.; Shaw, John D. 2021. TreeMap 2016: A tree-level model of the forests of the conterminous United States circa 2016. Fort Collins, CO: Forest Service Research Data Archive. https://doi.org/10.2737/RDS-2021-0074
Latest posts by Jolie Leung (see all)
- Climate Change’s Effect on Tree Communities - May 1, 2023
- Data-Driven Personas - May 1, 2023