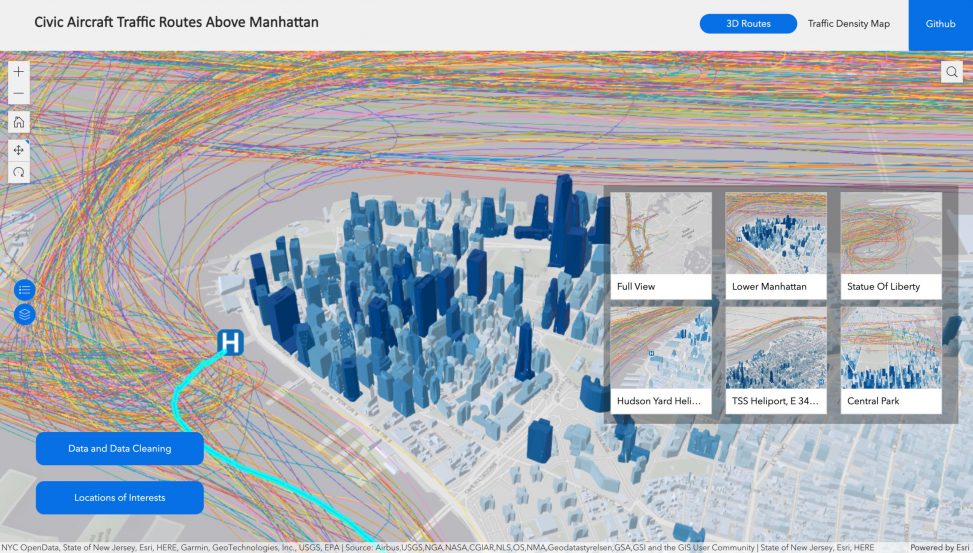
Zigi Wang and Jiacheng Chen decided to take an incomplete idea from a summer internship and try to make it happen. They were primarily interested in producing a 3D visual of the helicopter flying routes, some geospatial analysis on the data (places they like to visit, airports they like to stop by), and produce some time series graphs to show when the city is the busiest with helicopters (volume of helicopters in a perimeter near a location of interest). The 3D graphs and spatial analysis as well as the dashboard are all done in ArcGIS Online/ArcGIS Pro, however, all the data analysis are all done in Python. View the completed visualizations here.
Ziqi Wang
Latest posts by Ziqi Wang (see all)
- Manhattan Helicopter map - May 1, 2023
- My fellowship at Pratt Center for Community Engagement - May 1, 2023
Data Analytics and Visualization 2023
Latest posts by Jiacheng Chen (see all)
- Manhattan Helicopter map - May 1, 2023