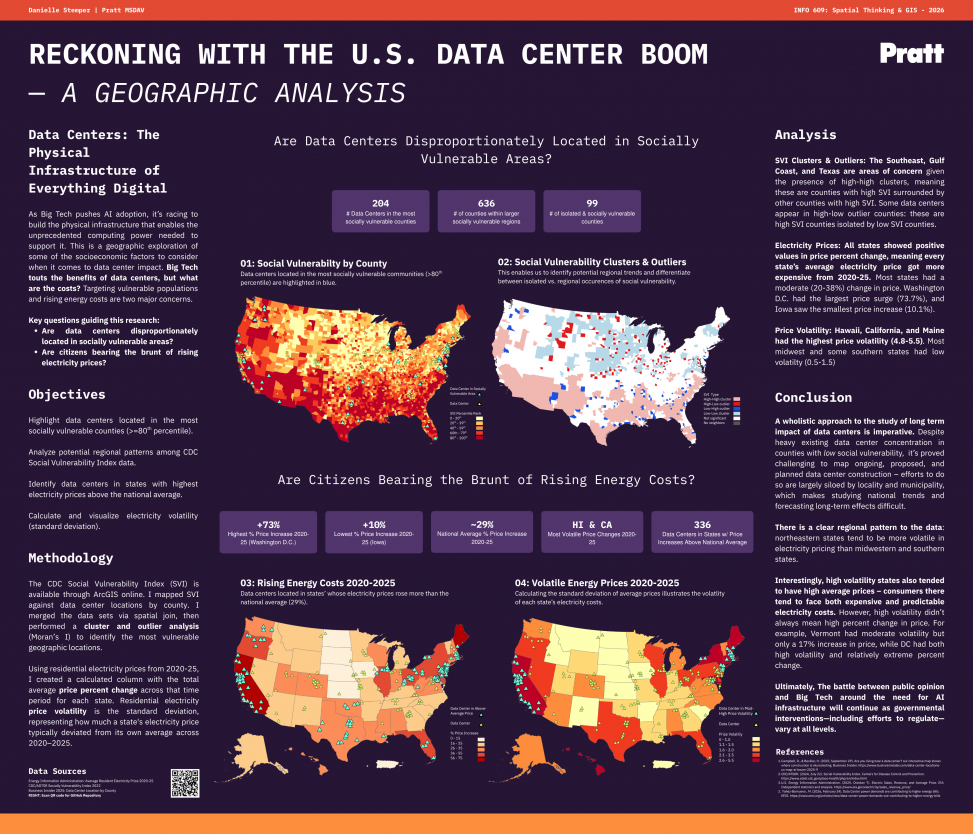
Data Centers: The Physical Infrastructure of Everything Digital
As Big Tech pushes AI adoption, it’s racing to build the physical infrastructure that enables the unprecedented computing power needed to support it. This is a geographic exploration of some of the socioeconomic factors to consider when it comes to data center impact. Big Tech touts the benefits of data centers, but what are the costs? For example, the targeting of vulnerable populations and rising energy costs are two major concerns.
Key questions guiding this research:
- Are data centers disproportionately located in socially vulnerable areas?
- Are citizens bearing the brunt of rising electricity prices?
Research Objectives
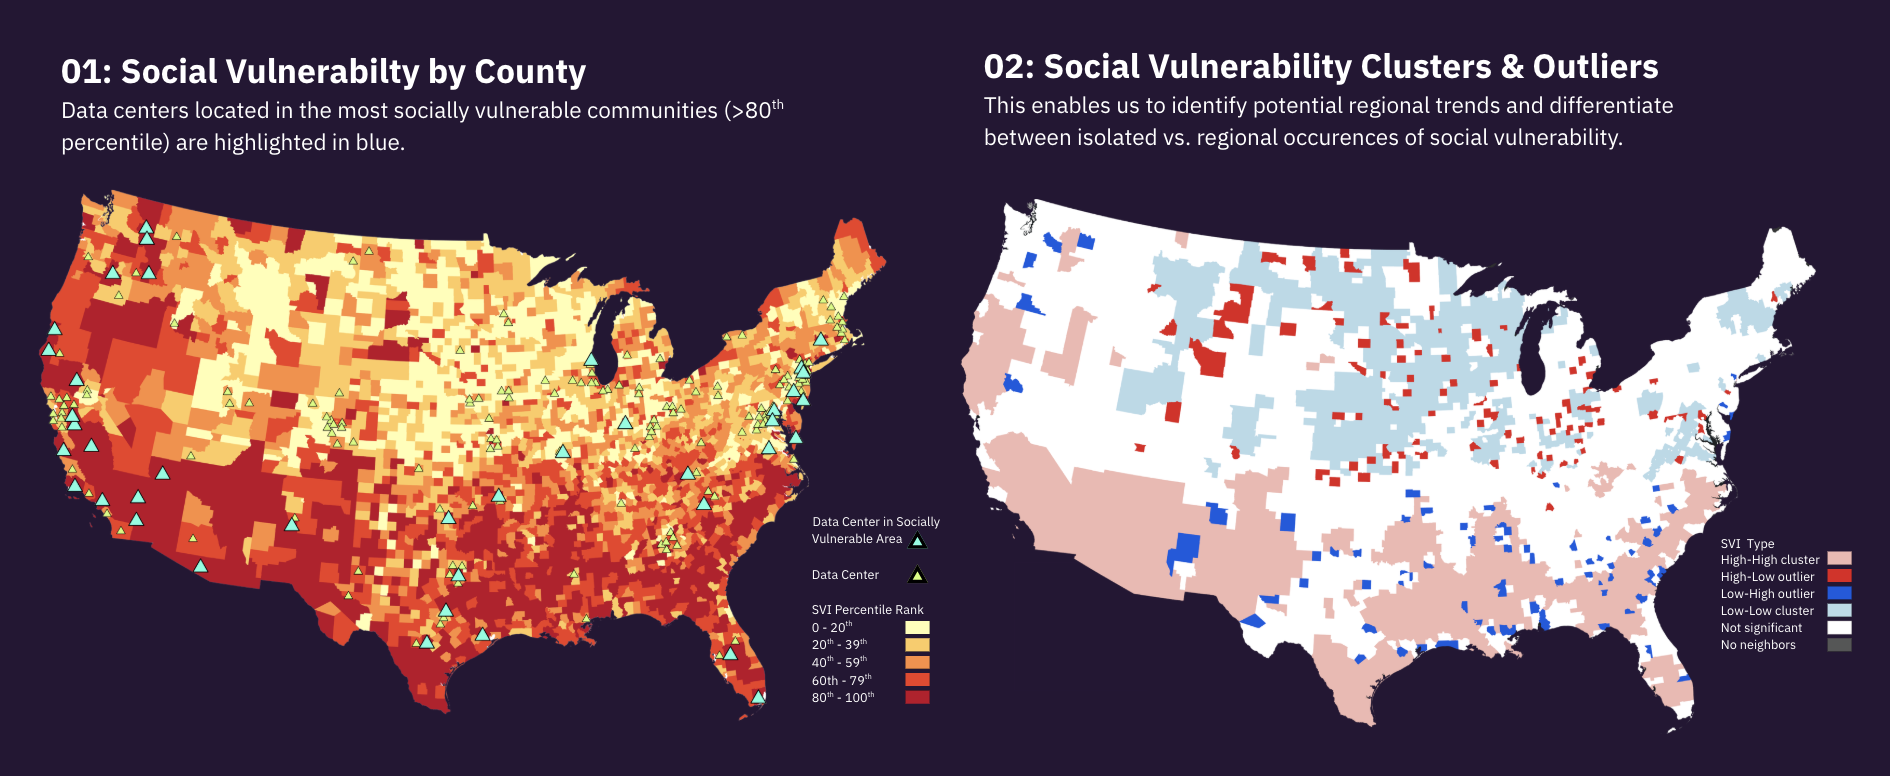
- Highlight data centers located in the most socially vulnerable counties (>=80th percentile).
- Analyze potential regional patterns among CDC Social Vulnerability Index data.
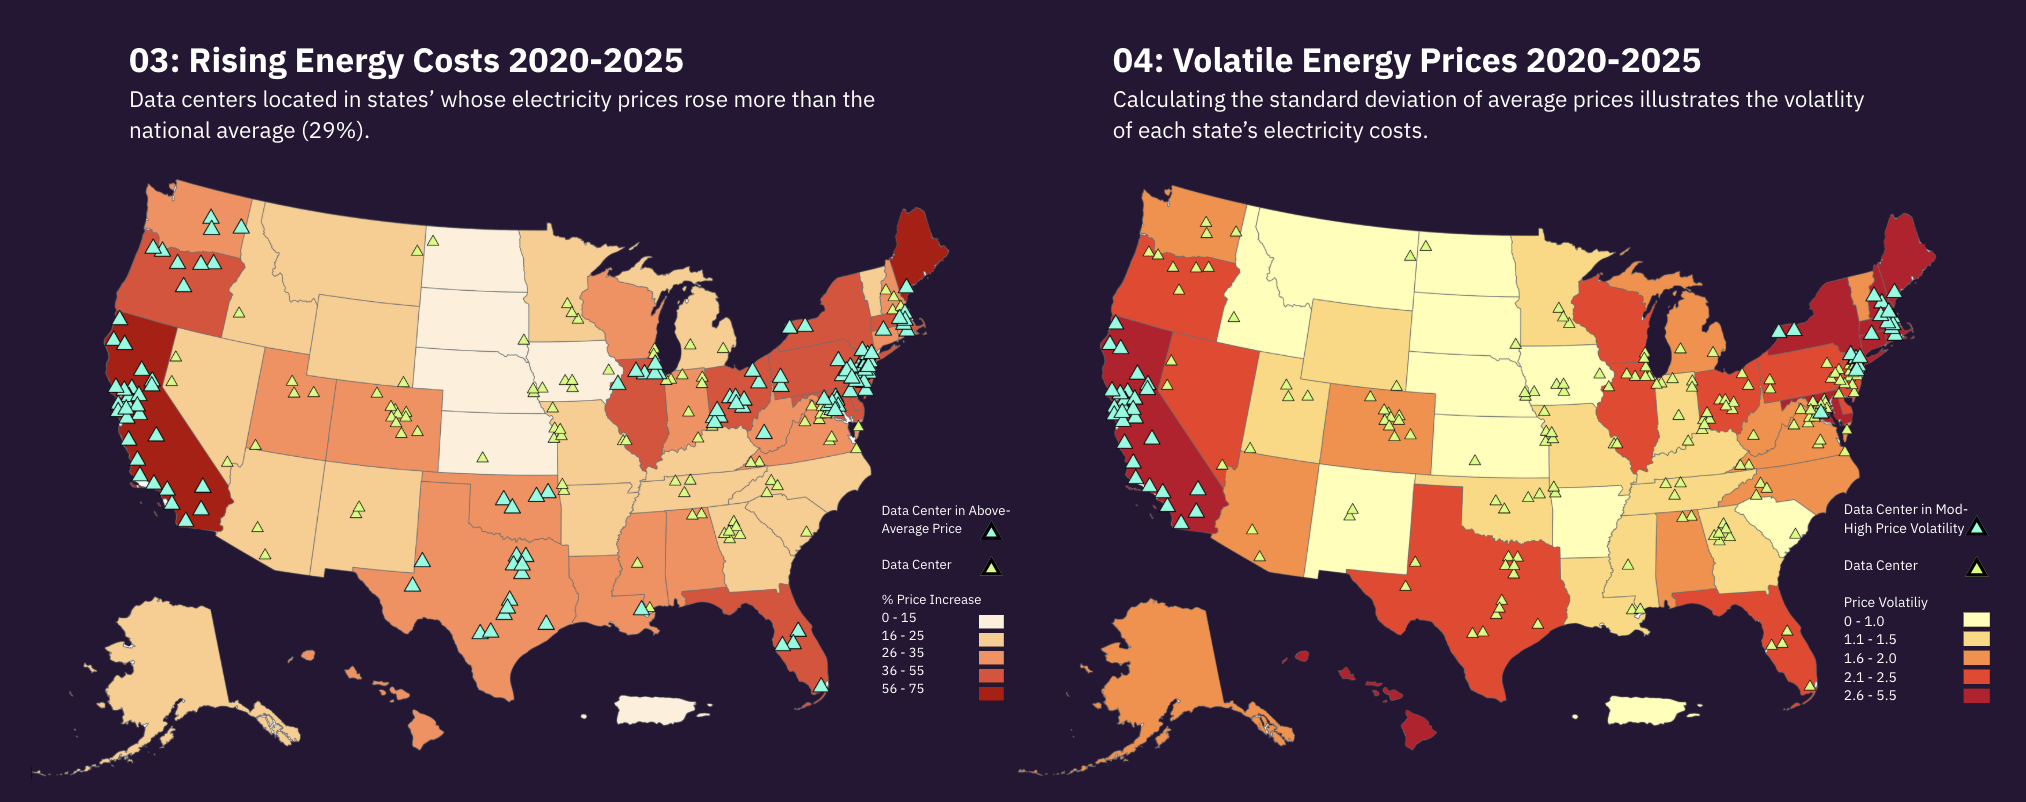
- Identify data centers in states with highest electricity prices above the national average.
- Calculate and visualize electricity volatility (standard deviation).
Methodology
The CDC Social Vulnerability Index (SVI) is available through ArcGIS online. I mapped SVI against data center locations by county. I merged the data sets via spatial join, then performed a cluster and outlier analysis (Moran’s I) to identify the most vulnerable geographic locations.
Using residential electricity prices from 2020-25, I created a calculated column with the total average price percent change across that time period for each state. Residential electricity price volatility is the standard deviation, representing how much a state’s electricity price typically deviated from its own average across 2020–2025.
Analysis
SVI Clusters & Outliers: The Southeast, Gulf Coast, and Texas are areas of concern given the presence of high-high clusters, meaning these are counties with high SVI surrounded by other counties with high SVI. Some data centers appear in high-low outlier counties: these are high SVI counties isolated by low SVI counties.
Electricity Prices: All states showed positive values in price percent change, meaning every state’s average electricity price got more expensive from 2020-25. Most states had a moderate (20-38%) change in price. Washington D.C. had the largest price surge (73.7%), and Iowa saw the smallest price increase (10.1%).
Price Volatility: Hawaii, California, and Maine had the highest price volatility (4.8-5.5). Most midwest and some southern states had low volatilty (0.5-1.5)
Conclusions
A wholistic approach to the study of long term impact of data centers is imperative. Despite heavy existing data center concentration in counties with low social vulnerability, it’s proved challenging to map ongoing, proposed, and planned data center construction – efforts to do so are largely siloed by locality and municipality, which makes studying national trends and forecasting long-term effects difficult.
There is a clear regional pattern to the data: northeastern states tend to be more volatile in electricity pricing than midwestern and southern states.
Interestingly, high volatility states also tended to have high average prices – consumers there tend to face both expensive and predictable electricity costs.
However, high volatility didn’t always mean high percent change in price. For example, Vermont had moderate volatility but only a 17% increase in price, while DC had both high volatility and relatively extreme percent change.
Ultimately, The battle between public opinion and Big Tech around the need for AI infrastructure will continue as governmental interventions—including efforts to regulate—vary at all levels.
Poster