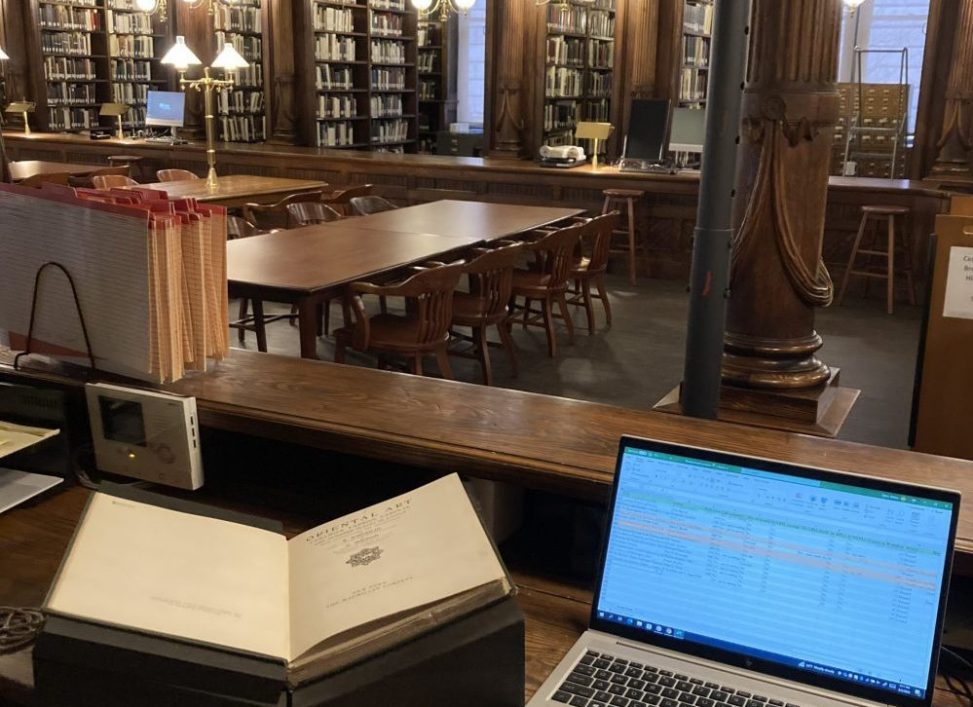
As a fellow at the Center for Brooklyn History Othmer Library, I undertook a long-term project to record and analyze data from the call slips used to request archival materials.
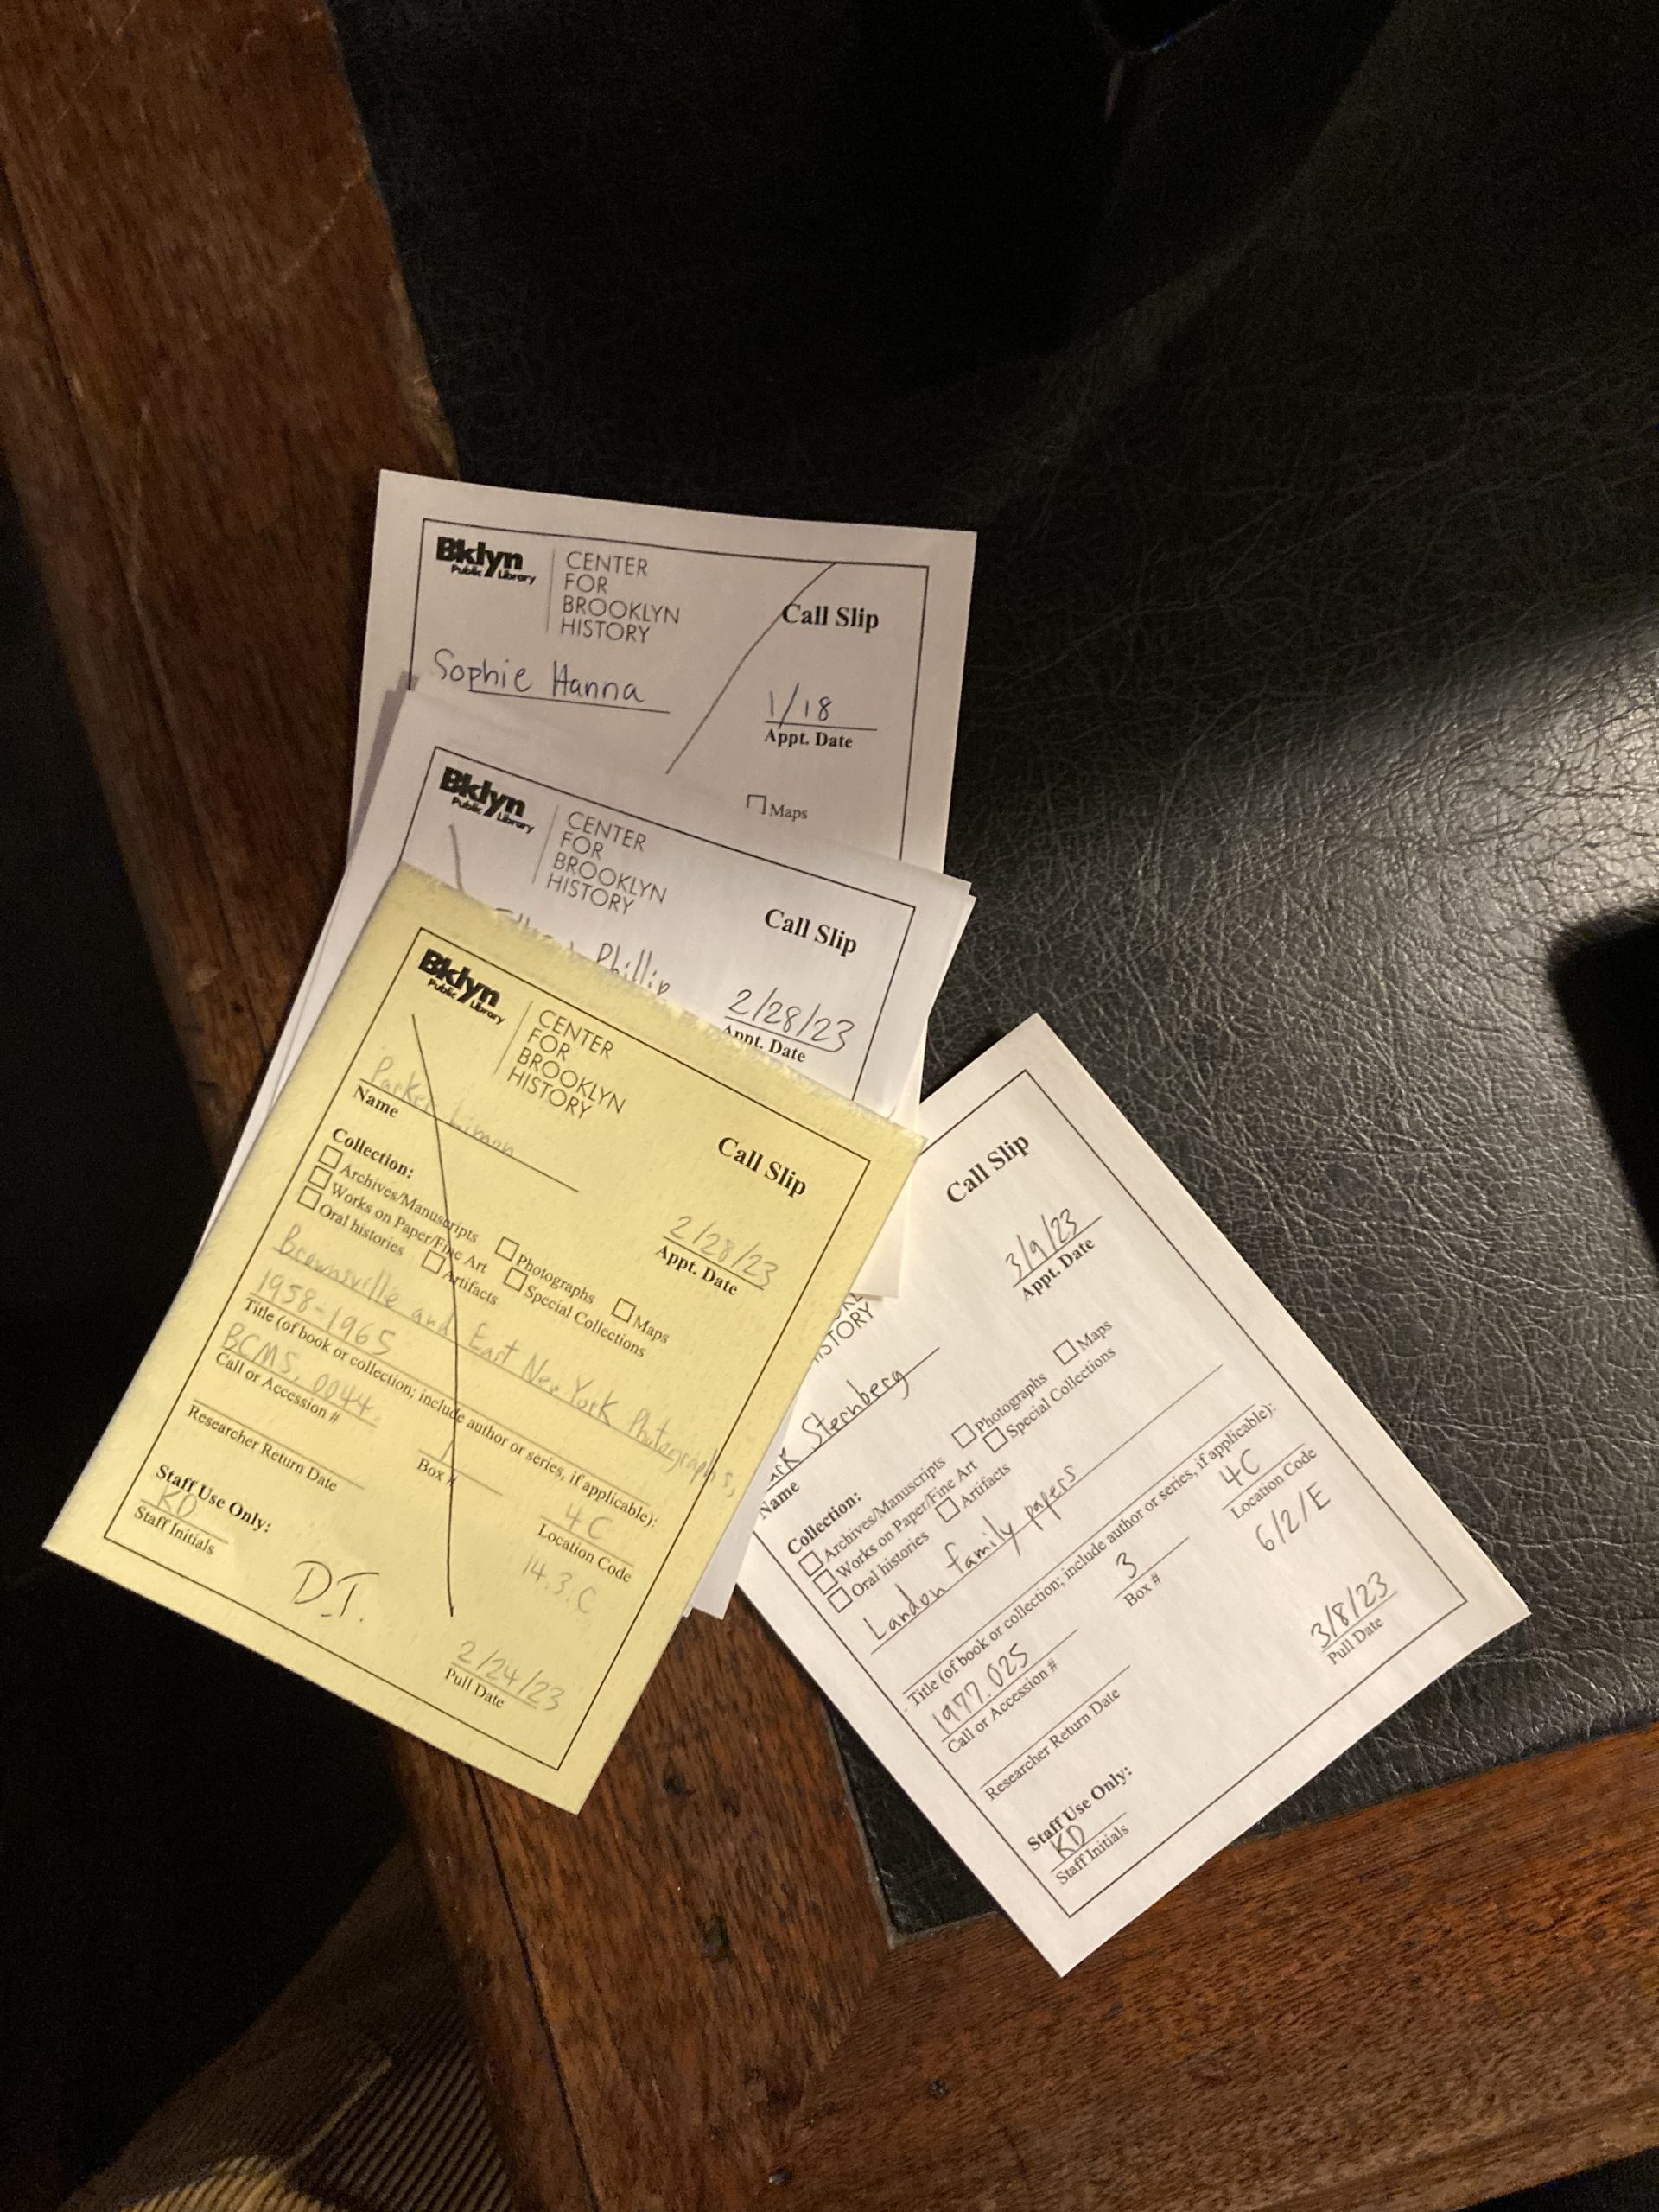
First, I created a spreadsheet and entered the appointment date, collection name & call number, box number and pull date from over 1,000 paper call slips, creating a dataset that represented over a year of patron research activities at the CBH library. Using what I was learning in my Programming for Cultural Heritage course at Pratt, I then wrote a Python script to analyze the data and create smaller data sets showing information about how much each collection was used and displaying patterns in patron behavior. I uploaded each cleaned-up dataset to Tableau, and created a set of visualization dashboards to serve as a final report for my colleagues.
My goal is for the report to be a useful tool for CBH staff, especially because the institution, changing its official name from the Brooklyn Historical Society to the Center for Brookly History, was recently integrated into the Brooklyn Public Library system and is in a period of large-scale transition.
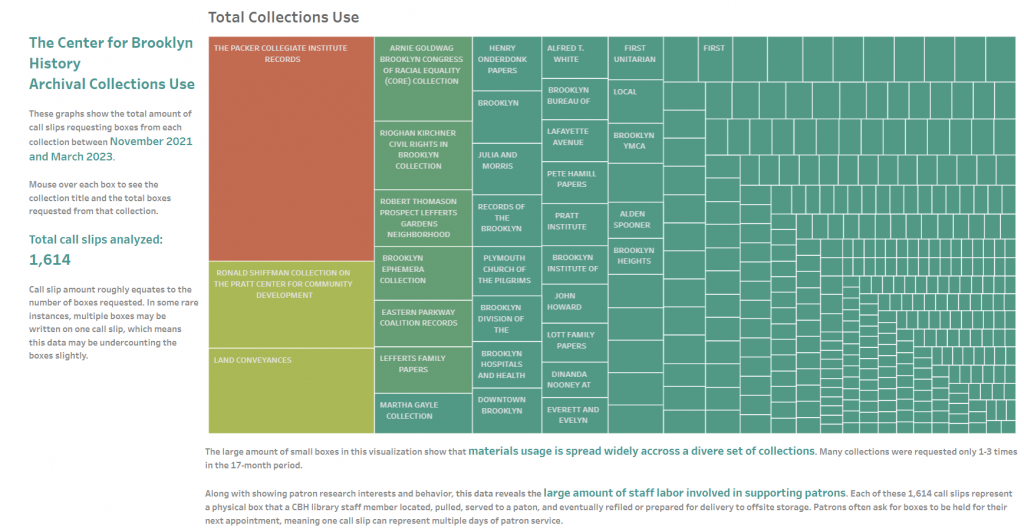
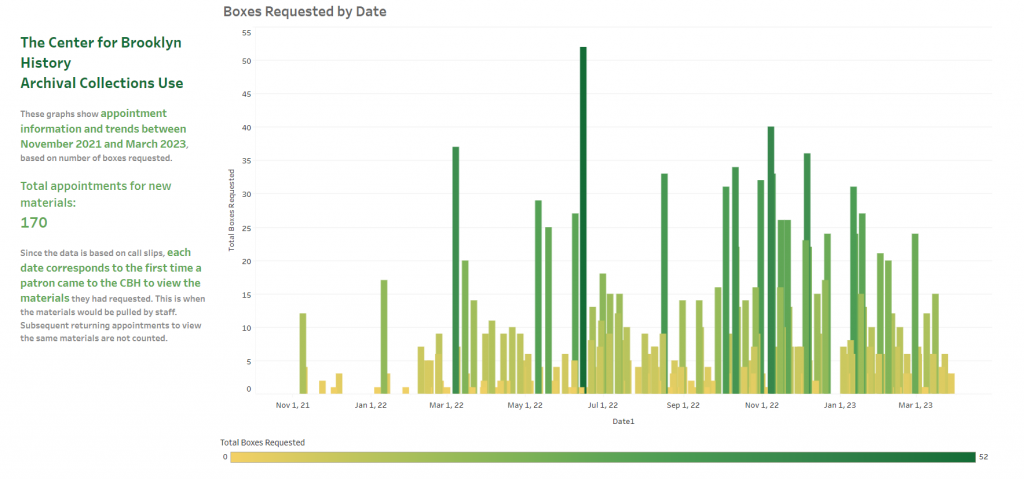
Above are screenshots of two of the visualizations I created in Tableau. To view all the visualizations in interactive dashboards, visit the workbook on Tableau Public.
To access the Python script I wrote to analyze the main spreadsheet containing entries for each call slip, visit my GitHub repository. I wrote to multiple CSV files to create small datasets that could easily be translated into visualizations.