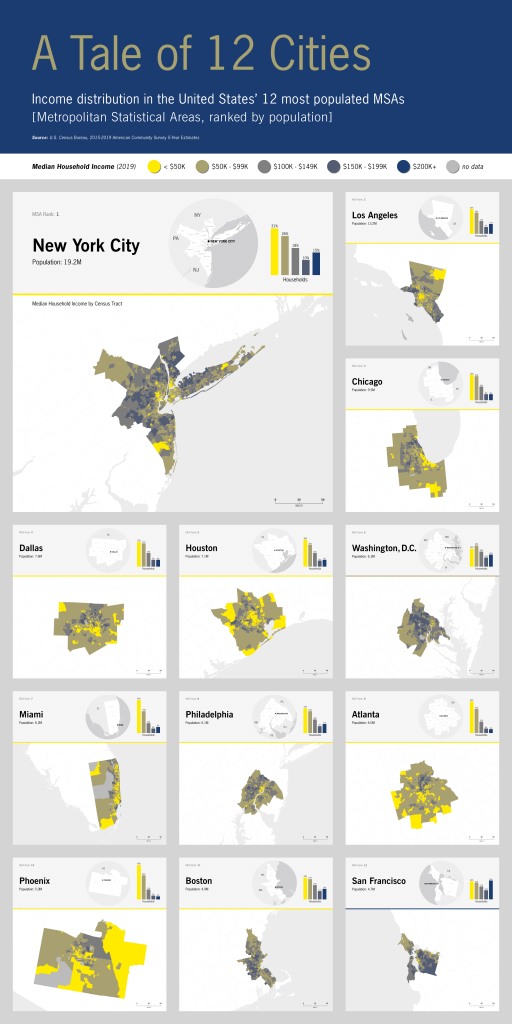
A snapshot of income inequality in the US’s 12 most populated urban areas
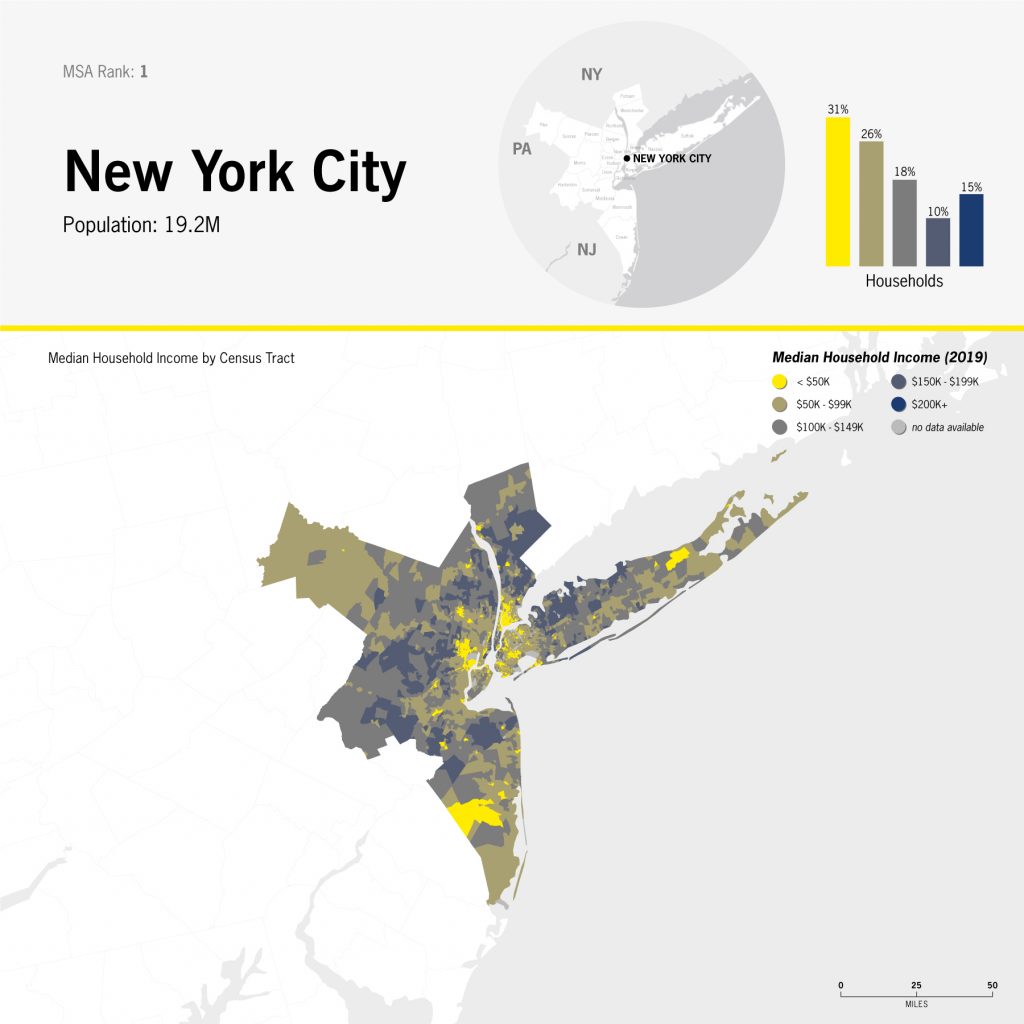
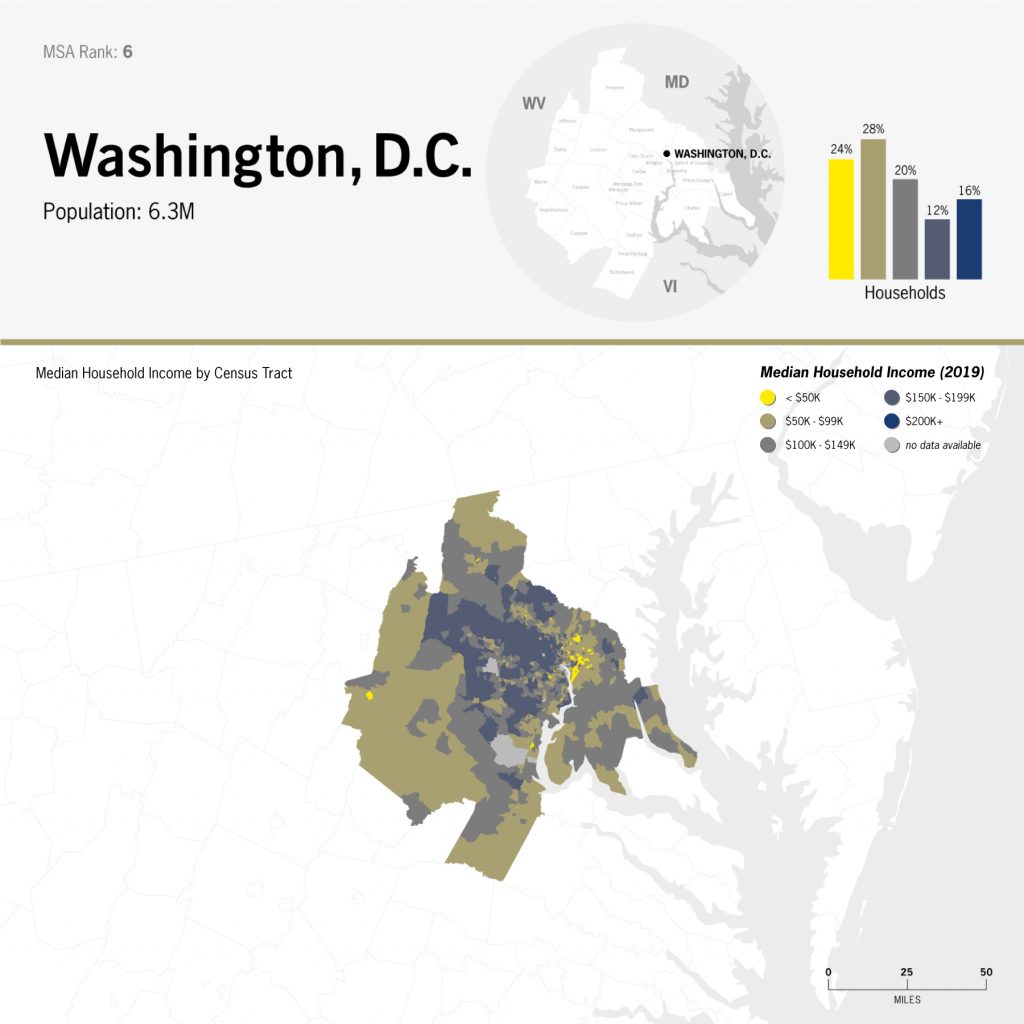
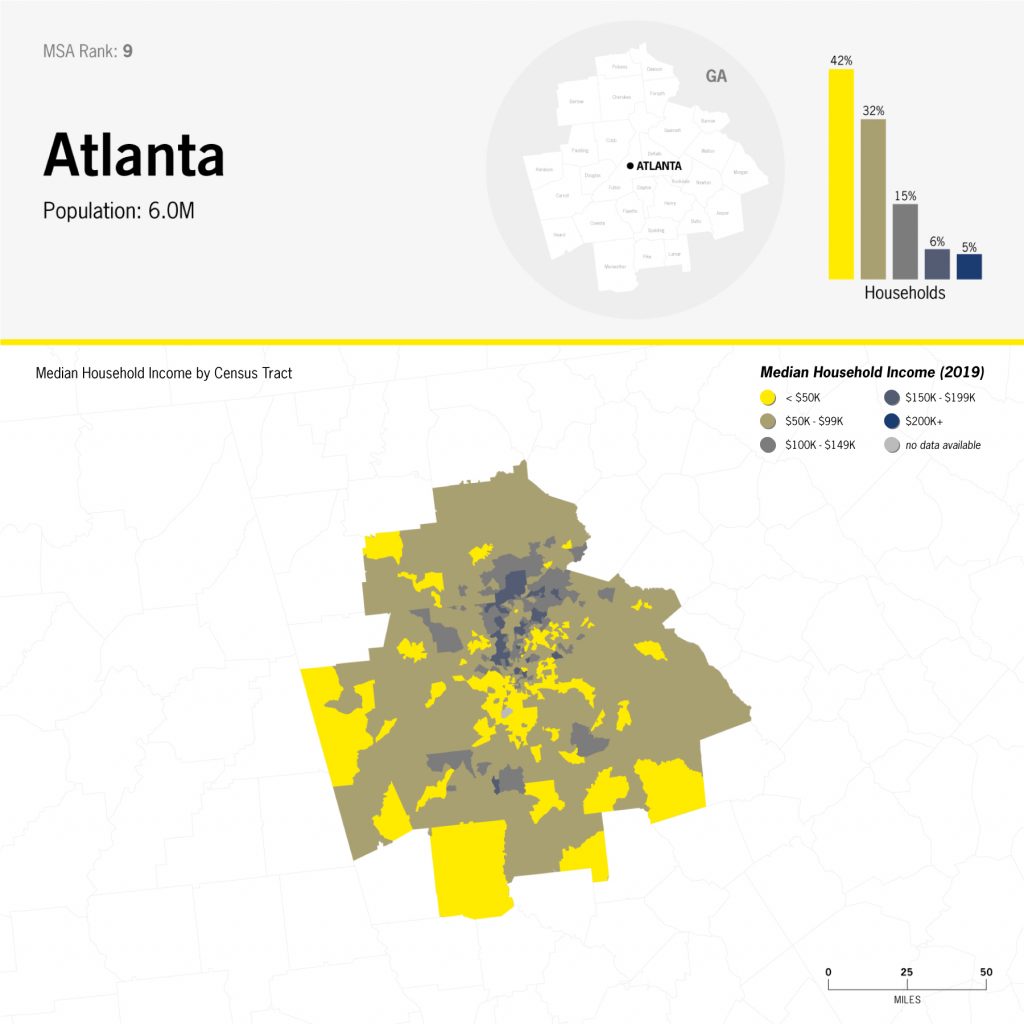
Working with US Census data in QGis, I created choropleth maps of the most populated MSAs (Metropolitan Statistical Areas) displaying the varying median household incomes by census tract.
You can view complete project here
experienced art director / graphic designer seeking to re-focus my career on data visualization
Latest posts by Diane Ferrera (see all)
- A Tale of 12 Cities - May 10, 2021