Tag: card sorting
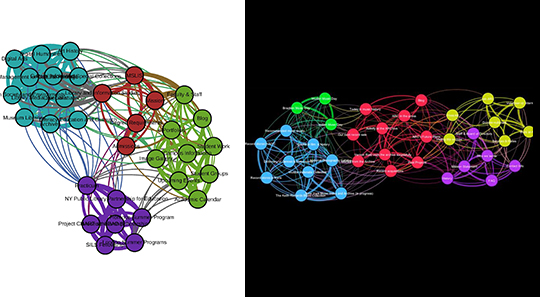
This project uses data generated in LIS 643 and network visualization software used in LIS 658 to analyze participants’ grouping of web pages during a cardsort exercise and explores the efficacy of using network visualizations of this data.