The World Between Empires

I recently paid a visit to the Metropolitan Museum of Art’s exhibition The World Between Empires: Art and Identity in the Middle East. The show covers art from about 100 BC to 250 AD, an era during which the Roman Empire in the west and the Parthian Empire in the east ruled the region. It occupies the museum’s largest exhibition space which has been subdivided into about a dozen galleries, each focusing on a particular area or culture within the region as a whole. Objects in the show were overwhelmingly ‘artifactual’ in nature — pieces of architecture, sculptures, coins, and decorative arts — with a handful paintings on plaster.

These galleries are arranged in a linear fashion, such that every visitor proceeds through the show following the same path, which conceptually follows the trade routes from southwestern Arabia, up through the Levant, and into Mesopotamia. By ‘guiding’ viewers through the show with a predetermined order, the curators are able both to enforce a narrative as well as draw out similarities and distinctions between bordering cultures.

As with most exhibitions at the Met, the primary source of information is in the form of the artworks themselves, wall plaques which describe and give context to the works, and supplementary commentary usually introducing a particular gallery and thus a particular culture.

Visitors are first greeted by a large wall text that introduces the show. This is the one bit of text which nearly every visitor stopped to read — perhaps due, in part, to the fact that it is nearly the only thing in the gallery — and thus must do a lot of the heavy lifting for contextualizing everything else that they will see. It also means that the design of that space is one of congregated people staring at a wall for a few minutes each. It’s something of an odd sight but it emphasizes the power that these few paragraphs will have in priming visitors’ engagement with the show.

Having entered the exhibition proper, one of the first things I wanted to focus on was the ‘speed’ with which visitors moved through the galleries. How many were looking at each object? How many were reading the wall plaques? &c. I sampled these patterns at three points in the show: in the first gallery, about midway through the show, and in the final gallery. Interestingly, it was in the middle gallery where people were most engaged with the works and with the texts. The final gallery saw the highest percentage of visitors ‘just walking through’, and the early gallery was between the two, but closer to the high level of engagement of the middle gallery. I suspect that part of the reason the early gallery saw less engagement was because it was also the most crowded, so either consciously or unconsciously, more ‘skipped’ this gallery to space themselves out, rather than waiting behind crowds to view objects. Curiously, the percentage of people reading wall texts (i.e., the general context-setting texts in each gallery, not the plaques for particular works) was about the same in each location: only ~15%.

The second thing I wanted to observe was, of those who engaged with works’ plaques, how did those plaques interleave with their viewing of the object myself? For example, I myself usually take a brief glance at the work, read the plaque, and then returning to the work. About two thirds of visitors engaging with the texts, however, essentially did the reverse: view the work, turn to the plaque for a varying amount of time — sometimes skimming, sometimes reading the entirety — glance back at the work briefly, and then move on to the next work. This variation in the order of engagement will inevitably shape how the plaque interprets the work and vice versa. ‘What did I just see?’ versus ‘What am I about to see?’ Understanding how people move between object and text might in turn inform what text should accompany a given work.

Finally, I wanted to observe the effect of object placement within the galleries. For example, objects along a wall, rather than in the center of the gallery; or objects in the middle of the wall or in a corner. On the whole, placement in this regard largely did not seem to matter. The one exception to this is that objects furthest from the ‘flow’ of a gallery were viewed slightly less than those in the mainstream of that ‘flow’; and this was regardless of how large or small the out-of-the-way object was or whether against a wall or in the middle of the room.

There were, however, individual visitors with identifiable viewing patterns. Several people — most often those moving through the gallery most quickly — primarily engaged with objects not against walls (which often tended to be larger ‘feature-size’ objects). On the other hand, one visitor stuck close to the walls, and for the entirety of the time I observed him, never approached an object not against the wall. From the general observations, however, it would seem that placement is more flexible than I would have thought, leaving curators free to use placement as a means of relating objects to one another without having to worry much about an object being in a ‘prime location’.

There was not much digital information throughout the galleries, with the exception of one gallery dedicated solely to a 12-minute video. Preceding the galleries on Palmyra, Dura-Europos, and Mesopotamia, the video is an interview with three archaeologists discussing the recent destruction of many monuments and artifacts in these regions by Islamic State and others. I was curious to see how many visitors would watch the video and for how long. Nearly everyone (~80%) stopped to watch for at least some time. About 60% watched for only a few minutes, while the remaining 20% watched all, or nearly all, of the video.

I would be curious to know how this compares to video installations in other exhibitions. Unlike many installations, the gallery is not ‘off to the side’, such that one must actively choose to entire the installation space, nor is it a small screen alongside other works. This is the only thing in the gallery, it is projected against an entire wall, and one must pass through in the course of making one’s way through the show. These gallery features, along with its darkness between other brightly lit galleries, serve both to ‘confront’ viewers with the interviews, easing their way into watching it, while also convey that this is something important, which the curators want everyone to watch, and not just another work alongside the other 200 in the show.

All in all, though a museum exhibition like this is largely, to the passive observer, a largely non-interactive experience for visitors, there are nonetheless clear patterns of interaction which develop as visitors engage with the works, with descriptive plaque texts, and context-setting wall texts and maps. By consciously looking for these patterns, one can see ways in which a curator might draw special attention to an object, such as was done with the video gallery.
Event: Cyber Talk: The Future of Smart Cities

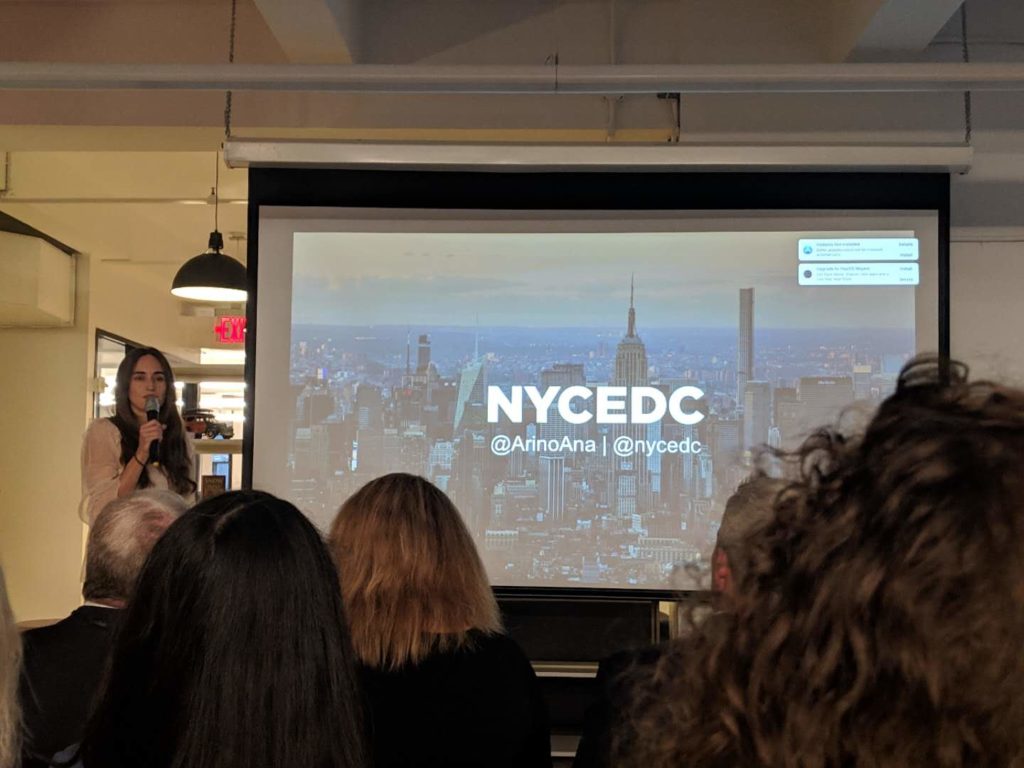
According to United Nations, 68% of the world’s population is expected to live in urban areas by 2050, adding about 2.5 billions new urban dwellers in the already overloaded cities in the next 30 years. Aiming to enhance citizens’ experience and promote better city decision-making, Smart City has long be anticipated as the next generation of urban evolution. However, the concerns around data privacy and security can not be ignored. On March 25th, I attended “Cyber Talk: The Future of Smart Cities”, an event curated by SOSA NYC, featuring two keynote speakers: Ana Arino (Chief Strategy Officer, NYCEDC) and Yaniv Harel (General Manager Cyber Solutions Group of Dell EMC) and a Smart Cities Panel with Micah Kotch (Managing Director of Urban-X), Sasson Darwish (Managing Director RBC Capital Markets) and Ohad Snir (General Manager – US of Nexar), focusing on the on-going Smart City projects and cybersecurity.

Although very much unnoticeable, as the city mostly remained the same at glance, NYC was awarded the “Best Smart City” in 2016. In fact, the density of infrastructure and the scale of educated workforce makes NYC an ideal experimental field for innovative solutions. On top of that, the vulnerabilities of the current aging infrastructure creates severe challenges, forcing the government to work in partnership with the private sector and academic institutions (Arino, 2019). Numerous smart cities projects, including BigBelly (a smart waste management system) and LinkNYC (free WIFI and phone hotspot kiosk with 911 emergency button and charging outlets) has been deployed across the city. In addition to upgrading the existing infrastructure, NYC also showed its ability to take on new challenges. Hudson Yards, as the biggest private real estate development in the history of United States, is integrated with innovative smart city technologies and showcased how those technologies can benefit local residents. Another way to implement Smart City strategy is to build a city from scratch, as what Sidewalk Labs currently working on in marshlands near Toronto, Canada. The project allowed them to experiment their vision of a city operating system, build infrastructure, connected buildings, connected transportation and digital overlay above the city. Even though the vision itself can not be replicated to existing cities as a whole, but it might be partially adopted in any new buildings and neighborhoods within those cities. 

Since there is no regulation regarding information collected by private businesses, those ambitious technologies solutions coined in the city have raised concerns around data privacy and security, as most of them are led by private companies due to the massive cost which public entities can not afford. For many companies the current business model is based on monetizing data, and it is surveillance capitalism which “preys on dependent populations who are neither its consumers nor its employees and are largely ignorant of its procedures”(Zuboff, 2016). However, even we are aware of the procedures, we can not avoid being tracked by the sensor on the phone or CCTV monitoring the streets especially living in a city like New York. What is more, in the future city where everything is connected, an unconnected individual may be exposed in danger, or be overlooked by certain city services since other devices can not detect your existence. How much information does the technology solution need to ensure the individual is being take care of without knowing too much? The line between privacy and safety is yet to be defined.

Another interesting question need to be further discuss is the boundary between public and private. As we are all citizens, does the data generated by us, which contains no personal information,  be seen as public resources? If our data was eventually pulled into a data lake own by the government, do we have the obligation to share our data? Or does the government has the right to force the companies holding data generated by individuals to share and expose those information, so other developers could build public welfare applications on top of it? 

In conclusion, I think our society is not yet ready to move on to the next evolution, both technologically and ethically. The panel made me realized advanced technology is not a solution for every issue and a new business model need to be create in order to eliminate the information privacy concern. But to start the process, maybe government and private companies need to convince the public that those smart solutions benefit the average person and one way to achieve that is involving the community in early stage of the project to build trust. 

INFO 601-02 Assignment 3: Event by Xin Su

Zuboff, Shoshana (5 March 2016). “Google as a Fortune Teller: The Secrets of Surveillance Capitalism”. Frankfurter Allgemeine Zeitunghttp://www.faz.net/aktuell/feuilleton/debatten/the-digital-debate/shoshana-zuboff-secrets-of-surveillance-capitalism-14103616.html?printPagedArticle=true. Retrieved 9 February 2017.

Israel in New York (2019, March 25). Cyber Talk: The Future of Smart Cities [Video file]. Retrieved from https://www.youtube.com/watch?v=KzyA8KNPiNE

Creating Inclusive Digital Spaces Through Information Architecture

INFO 601-02 ASSIGNMENT 3 : EVENT ATTENDANCE BY UMANG ARORA

Information Architecture (IA) is defined as “simply a set of aids that match user needs with information resources.” (Davenport, 1997). In essence, it enables access to content by providing a systematic and primarily a visual approach to the organization of content and thus facilitates the quest for information. It aims to organize content so that users can navigate and adapt easily to the product’s functionality and find everything they need without much effort.

Logic Dept is a team of Information Architecture consultants, who provide research-based guidance to companies, using research to identify problems and finding functional solutions to build a better website and user experience.

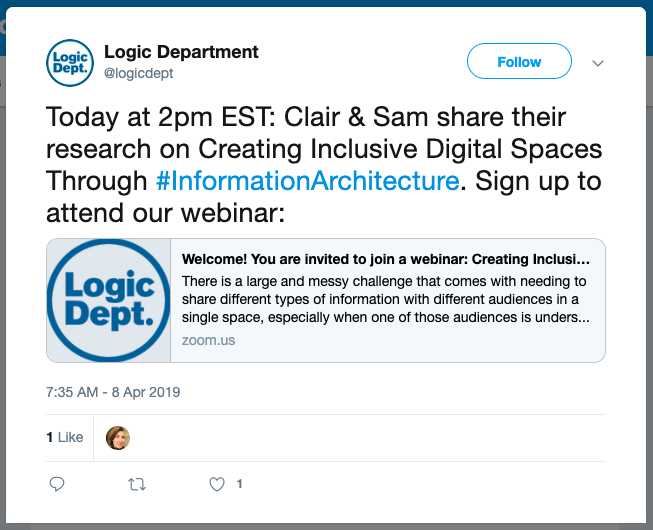
On April 8th, 2019, Logic Dept hosted a webinar on the topic “Creating Inclusive Digital Spaces Through Information Architecture”, addressing the challenge of sharing different types of information with different audiences in a single space, especially when one of those audiences is underserved. Countless efforts have been made to create accessible content on the web for the differently-abled, but the conversation about creating accessible content for the LGBTQ+ populations is just beginning. The webinar was hosted by Sam Raddatz, CEO and Lead Information Architect and Clair Rock, Junior Information Architect.

Before, explaining how language and hierarchy can make a site more accessible to different audiences with varying levels of understanding and sensitivity using the example of The National Center for Transgender Equality, they briefly explained what is  Information Architecture by quoting Abby Covert and stating a few examples, such as alphabetical cross-references system in the dictionary links in a website navigation, section labels and names of things in a restaurant menu, links in a website navigation, and the categories and labels used in software programs and applications. The speakers then mentioned and defined the common terms that will be used in the webinar.

The main focus of the webinar was links in a website navigation and how that IA affects how we use interfaces and websites. Clair went on to explain the idea behind this project, the process, and his decision of finding a website that focuses on LGBTQ+ issues. He wanted to address this project from an information architecture standpoint and wanted the website that served multiple and very different audiences. At the start of the project, he defined a few research goals : (1) How to make sensitive content inclusive to multiple audiences with very different backgrounds and entry points, (2) To help the trans community through improvements to a specific website by neutralizing the language and in turn normalizing the population.

Keeping in mind these goals, he started researching and exploring multiple websites and decided to use The National Center for Transgender Equality website since it had great content both for educational purpose and legal purpose but lacked aesthetic, and had a troubling kind of mash-up of content which made it difficult to navigate and find the required information. He stressed upon the fact that the findings through this research can be used in any other type of research as well. The multiple different audiences using The National Center for Transgender Equality website are trans folx, advocates of the LGBTQ+ community and folx from outside the community.

For research, they conducted two types of card sorting tests – moderated and unmoderated using the tool Optimal Workshop. Card sort is a method used to understand the organization of content on the website, it gives insight on how the users would expect to see the content and under which label. The moderated card sort allowed them to get a lot of qualitative data whereas the unmoderated card sort gave them a broader understanding of how people were interacting with the data. While doing the research they encountered a few things that can be broadly considered when doing any research with stigmatized audiences, such as recruitment. It is the trickiest part of any research, getting people to respond, volunteer their time and give their honest feedback. Especially with an extra layer of barrier, where one is trying to reach out to a community that’s been somewhat ostracized, it makes it even harder. They worked through safe outreach channels, internal advocates and made sure that they were clear about the intentions of the research. Lastly, they also considered the safety, confidentiality, and anonymity of the participants and gave them an option to stop the conversation or back out from research at any point they feel uncomfortable.

The hosts further explained the results of the card sort research and how they analyzed and came to a conclusion regarding labeling and navigation of the website for better user experience. In the end, the floor was open to question and answers and a lot of people had interesting questions such as what was the most interesting thing that you learnt? What would be the next steps into the project? How do you reach out to people who are difficult to reach like stigmatized communities? How has this work changed or will change your day-to-day work? Do you share your findings with the study participants, if so why or why not?

Some of the points to keep in mind while doing research especially with stigmatized population are (1) Use care, consider the safety and anonymity of both moderators and participants. Work with members of the community to boost the reach and trust. (2) Be inclusive, avoid stigmatized labels and language. Ensure tools and methods used are inclusive too.

References :

Toms, E.G. (2002). Information interaction : Providing a framework for information architecture.  https://doi.org/10.1002/asi.10094

https://uxplanet.org/information-architecture-basics-for-designers-b5d43df62e20

www.logicdept.com

Event: Business re-imagined with Machine Learning and Artificial Intelligence

AI is real and it can be used to benefit the business and competitive advantage. There is a strong relation between the analytical capabilities and AI capabilities of the company. The business value that AI offers is solid. It will improve products and processes and make decisions better informed.  

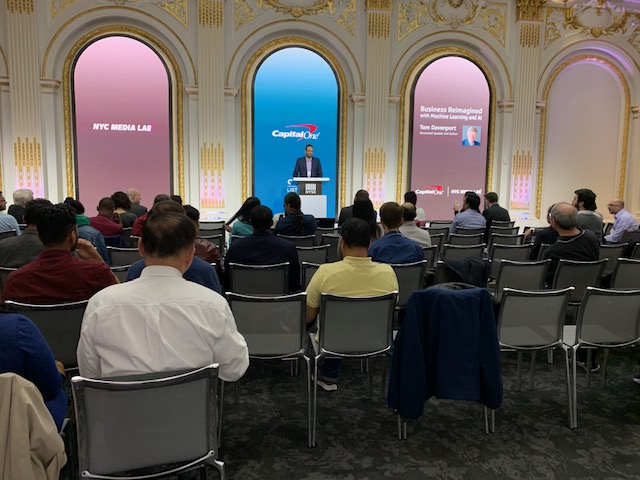
On April 9th 2019, Capital One and NYC Media Lab hosted an event on Machine Learning and Artificial Intelligence. The purpose of the event was to stimulate the deep discussions on the various aspects of future of machine learning and AI and real-world applications. This event looked into various aspects of machine learning such as the unprecedented impact on businesses and new considerations, challenges and opportunities that the technology will bring. The speaker of the event was Tom Davenport who is the professor of Information Technology and Management at Babson College, a fellow of the MIT initiative for the Digital Economy and a Senior Advisor to Deloitte Analytics.  

The seminar started with welcoming Tom Davenport on stage. Tom began with the seminar with stating the facts of AI in large American companies. He believes that 20-30% are AI aware and actively employing multiple technologies but very few put AI at first. Many firms are setting up AI management and infrastructure to automate jobs but AI have challenges of its own like implementation, integration, talent and data. But as he says the growth of AI is unavoidable. The questions initiated in this event were if we should have major ambitious AI projects or a number of small ambitious projects. 

AI technologies is a constellation of machine learning, neutral networks, natural language processing generation, rule engine, robotic process automation, digital workflows, custom integration and combination of these. But the most used technologies by companies are machine learning, deep learning, use of natural language processing and the robotic process. Tom mentioned that most AI projects fall into major three categories like robotics and intelligence automation for routine and data intensive administration tasks, AI based insights for insights from structured data and AI based engagement for interaction with customers or employees. AI not only helps in the automation of process but also benefit in enhancing the products, optimize the operations, make better decisions and many more.  

Tom gave few examples of companies having successful AI technologies. Vanguard, a financial portfolio management company, uses AI for One Big Application which is a “Personal Advisor Service”, it combines automated and human investment advice for portfolio rebalancing, tax loss harvesting and retirement income scenarios. Pfizer, a medicinal drug company, uses machine learning to classify prescribers of pain drugs and target discontinuing patients. Capital One uses machine learning to focus on credit decisioning and all aspects of customer interaction and operation. Google puts AI first to rank page and advertising algorithms. Google also has research labs to do research on AI and deep learning.  

Looking at these examples, Tom also explained that there are companies having both less ambitious and major ambitious projects which did not succeed. The most prominent example is of M.D. Anderson Cancer Center had a highly ambitious project to use AI to treat certain forms of cancer which treated no patient and the project was put on hold. But has a series of projects using CognitiveScale technology which is a success and it improve patient satisfaction, operational efficiency and financial returns. 

Although AI technologies are growing a fast pace but it will definitely have an impact on jobs and skills. But there will be primary challenges faced by companies like implementation, integration, cost of development and lack of skills. There will be jobs which will be to collaborate with smart machines. Tom believes that people can overcome this future employment issue if they strategize about how AI can transform and strategize your business model or process, start with less ambitious projects, emphasize on augmentation, take skills training, put an ethical framework in place and put someone or be in charge of AI. As Geoffrey C. Bowker, Karen Baker, Florence Millerand, and David Ribes stated in “Toward Information Infrastructure Studies: Ways of Knowing in a Networked Environment” that “it is the distribution of solutions that is of concern as the object of study and as a series of elements that support infrastructure in different ways at different moments”. To end with Tom says that we should be the solution by scaling up and skill out on AI than finding potential solutions about it. 

After attending this event it made me realize that I just don’t have to learn designing of the currently available technologies but also data and technology available in the future. As Gary Marchionini stated in “Human–information interaction research and development understanding” that “proflections form and evolve and discovering ways to manage them provide exciting new challenges to the information field’. As an information professional, through this event I understood that how I should adapt to Artificial Intelligence and create employment opportunities in IXD professions.  

Reference:

G. Marchionini / Library & Information Science Research 30 (2008)

Geoffrey C. Bowker, Karen Baker, Florence Millerand, and David Ribes  / Toward Information Infrastructure Studies: Ways of Knowing in a Networked Environment ,102

Richa Kulkarni, INFO 601-02

Event : The Video gaming Industry in NYC

The Center for Communication is a nonprofit actively engaged in bringing diversity to the media industry. It is offering students a chance to explore their career options, network and collaborate with influential professionals.

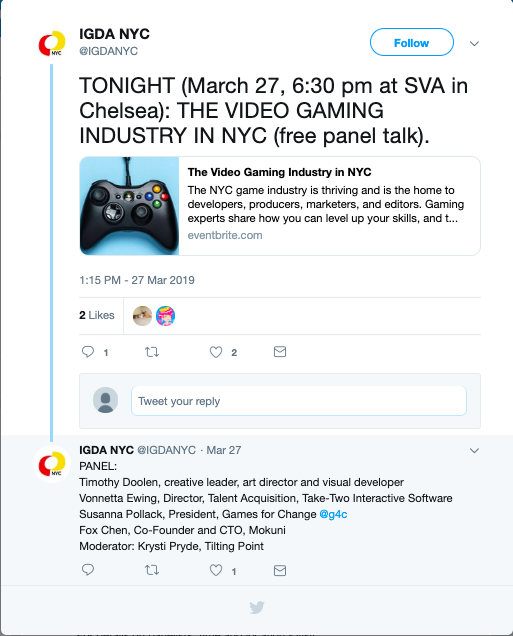
Center for Communication held the event “The Video Gaming Industry in NYC” at SVA Theatre on the 23rd street in New York on 27th March ’19. The Game Industry in NYC is burgeoning with expanding studios and start-ups. This development, coupled with New York’s unmatched exposure and networking opportunities, has just about shifted the gaming industry’s stronghold from the West Coast to the ‘Big Apple’. Smartphones, tablets and computers becoming so easily accessible for all has paved the way for the video gaming industry. As of 2018, this industry is generating as much as $135 billion.

Five gaming experts represented the thriving industry at the event. They talk about how one can add to or hone their skills in order to land a career in the world of games, and also what NYC has to offer for game fanatics and developers. 

  1. KRYSTI PRYDE Brand Marketing Manager, Tilting Point
  2. TIMOTHY DOOLEN Visual Developer, Graceful Decay
  3. VONNETTA EWING Director of Talent Aquisition, Take-Two Interactive Software Inc.
  4. SUSANNA POLLACK President, Games For Change
  5. FOX CHEN Co-founder and CTO, Mokuni Games

Video games have entertained users for many years, and over time the community of patrons has only grown. Gaming has come from special gadgetry and hardwares to handy smartphones and tablets. Essentially every person who holds a smartphone/tablet has at least one game on their device, and enthusiasts go further to download softwares, even buy gaming PCs and consoles. As the game industry makes this shift, the demand for developers multiplies. Committed professionals elevate the experience of gaming to meet new levels, and young ardent fans aspire to join the craft. 

The five speakers talk about their expertise and vocation before addressing the attendees’ questions pertaining to making a career in the field.  

It is true that when the industry was at a nascent stage, its development was identified particularly on the west coast of United States. However, with expansion the studios spread their wings to reach the east coast. Prominent studios such as Playcrafting, have established themselves in New York City. This has brought recognized experts, events & exhibitions, and opportunities to town. NYC’s growing community offers programs for people starting out or transitioning from other specialities, support and networking initiatives. 

One may wonder whether the opportunities to make a career in gaming industry of NYC come all the same for locals and non-locals. According to HR professional Vonnetta, nothing is more valuable to studios than a candidate’s aptitude and qualifications. Companies are seeking talent across the globe. 

What qualifications and skills are these employers really looking for? Clearly, knowledge of coding, engineering, algebra & geometry, computing, design thinking and graphics is expected. It largely depends on the position you are applying for. Beyond these the employers value soft skills, mainly clear articulation & communication, critical thinking, ability to collaborate, attention to detail, and of course creativity & efficiency. Having said that, a strong portfolio will do the groundwork. 

A fascinating fact about the current video gaming scene is that it is no more limited to game designers and developers. The industry is welcoming professionals of other disciplines as well as transferring candidates. The 5 experts emphasise on the possibility of transferring skills and knowledge. To name a few “sought-after” roles in gaming, other than design, data analysts & scientists, finance & accounting specialists, security infrastructure designers, marketing experts, developmental psychologists & behavioral scientists are good examples. A non-traditional role that was mentioned a considerable number of times is User Experience. More so, there is need for knowledge of music, and there is casting for voice talent too. There are opportunities for people from all walks of life. 

How to grab these opportunities is not a very difficult question if you are in NYC. Keep an eye out for the unending events, meets and conferences. Immerse in the community, network and get seen. Organizations constantly come up with competitions to attract new talent. Entry level talent can also get into the industry by taking up internships. Primarily, the key is to remain up-to-date with the industry news, stay engaged and connected with sources. 

As a student of Information Experience Design, I realised a new prospect for my professional career through this event. The video gaming community is more vast and driven than I imagined. It has developed to become a leading contributor of employment opportunities for professionals of IXD among others. Furthermore, the industry has devoted itself to not only producing sources of entertainment, but also to making social change. Organizations are committed to designing for improving cognition, mental health and well being. The event has taught me to acknowledge and appreciate the game industry.

https://www.centerforcommunication.org/calendar/2019/3/27/video-gaming

References:

Marchionnini (2008). Human information interaction. Library & Information Science Research 30

The Differing Roles Of the Ux Designer https://uxmag.com/articles/the-differing-roles-of-the-ux-designerhttps://uxmag.com/articles/the-differing-roles-of-the-ux-designer

Observation of National Geographic Encounter – Ocean Odyssey

By: Michelle Kung
INFO 601-02 Assignment 3 Event Attendance

What is it

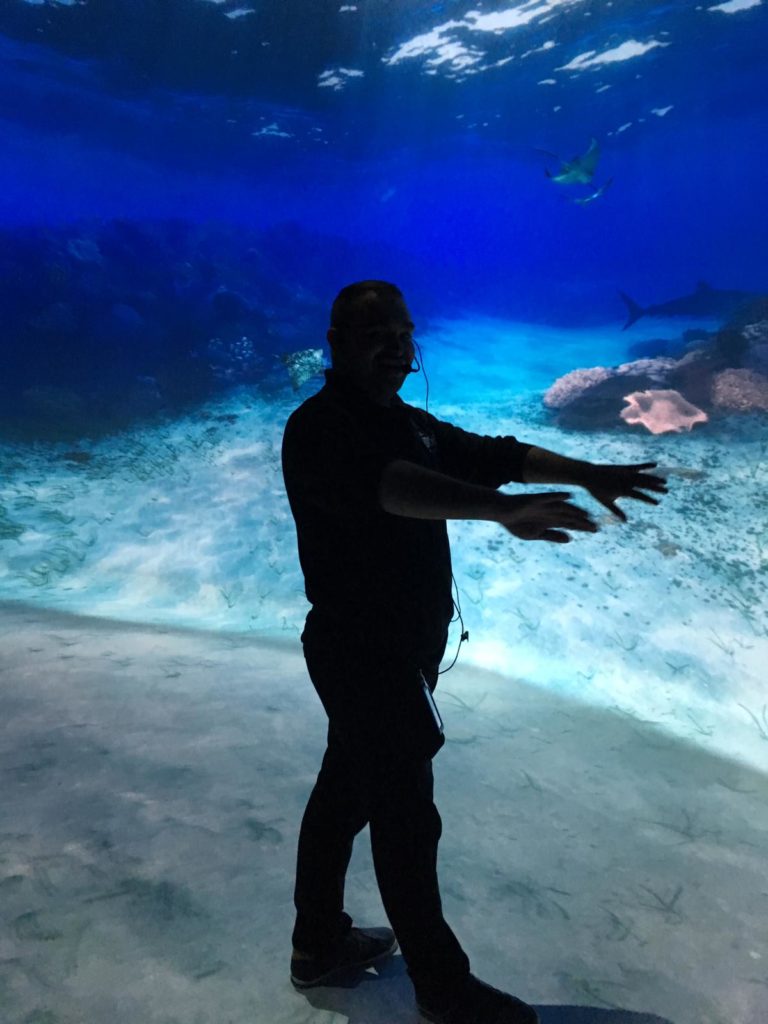
National Geographic’s Ocean Odyssey is an exhibition about marine biology and conservation that promises visitors an interactive and immersive experience. Visitors get to see, hear, and feel what ocean life is like for different sea creatures. A member of staff guides small groups of visitors through the interactive spaces and encourages everyone to explore every part of each space. The Ocean Odyssey starts in the shallows of the Pacific Ocean and takes visitors all the way to the Californian coast.  

I visited the Ocean Odyssey in March, 2019 had found this experience to both be a lot of fun and highly educational. The new technology used gave the exhibition a lot of affordances that visitors were not familiar with. And the guide, acting as mediator, served as the signifier to ensure that visitors’ experiences were pleasurable and not frustrating.

Immersive environments created by audio visual elements

Effective use of audio and visual elements made interaction with information truly immersive and entirely effortless.

Visual

The Ocean Odyssey experience featured multiple audio-visual displays. But unlike conventional single screen-based information, these experiences were highly immersive. Users were invited to enter rooms in which every surface was a screen, including the ceiling and sometimes even the floor. Many rooms had curved walls that surrounded groups of visitors. Our guide encouraged us to “swim” into the rooms, adding to the immersive experience. Many users attempted to interact with different visual elements, by pointing at them, stepping on them, and following them. Sometimes, digital elements responded to users’ physical movements but sometimes there was no digital/ physical connection. On the whole, visitors seemed delighted when interaction was possible and not at all disappointed when it wasn’t. Perhaps users haven’t developed an expectation to be able to interact with any digital element yet.

One of the most spectacular exhibits was a 3D video of a life size humpback whale displayed in a room on a curved wall that surrounded visitors. Visitors were invited to wear 3D glasses to improve their experiences. The video showed how humpback whales feed on krill by opening its gigantic mouth. Users were so mesmerised and immersed in the video that a user screamed out loud in fear when the photorealistic whale swam towards the screen with its mouth wide open! Such rich visual information elicited emotional responses in users.

Audio
Buttressing the vibrant visuals were rich and realistic audio elements. Effective use of sound allowed users to be immersed in the underwater environment created by the Ocean Odyssey. In an exhibit showing what the ocean is like in the night time, sound was the main medium. Users sat in a small auditorium completely devoid of light, listening to the sounds of whales, dolphins, and other sea creatures. Users were passive receptors of audio information. 

Interactive videos enraptured users

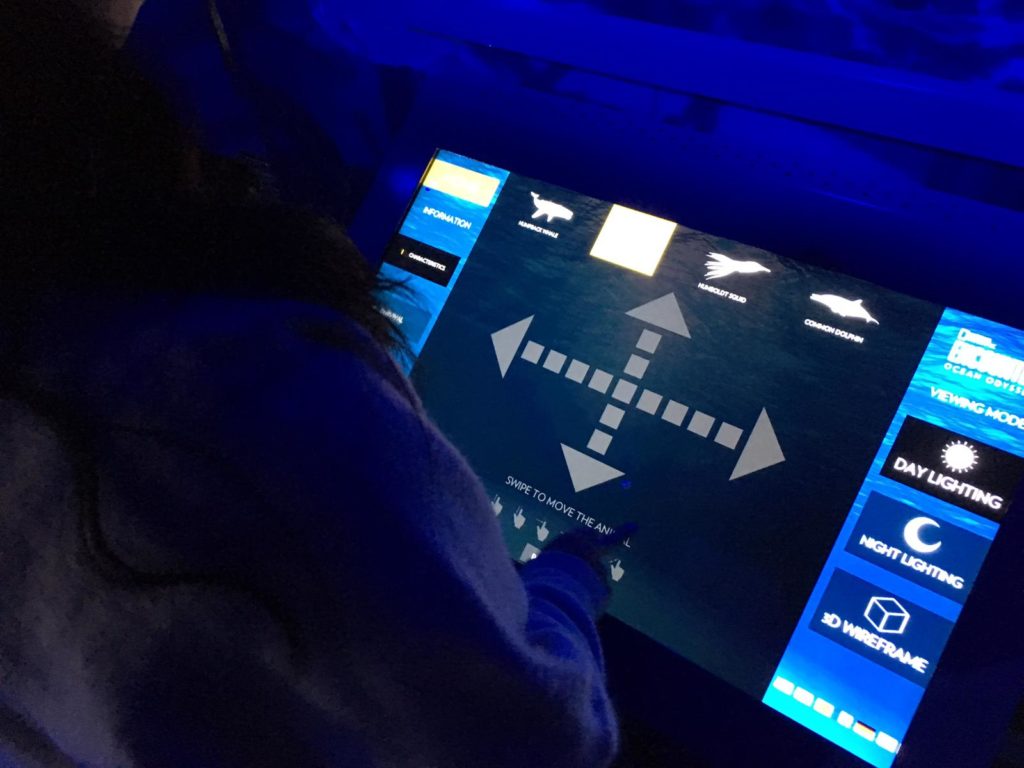
The Ocean Odyssey also featured gesture controlled interactive video elements to teach users about the behaviour of sea lions and about bio luminescence.

Our guide explained what bio luminescence was as users moved their arms in front of a screen. The screen detected motion and displayed corresponding lights, representing bioluminescent bacteria. Users were encouraged to interact tactilely with all elements of the bioluminescent exhibit. This hands-on approach allowed users to learn about an otherwise abstract part of the ocean that they have probably never heard of or thought about.

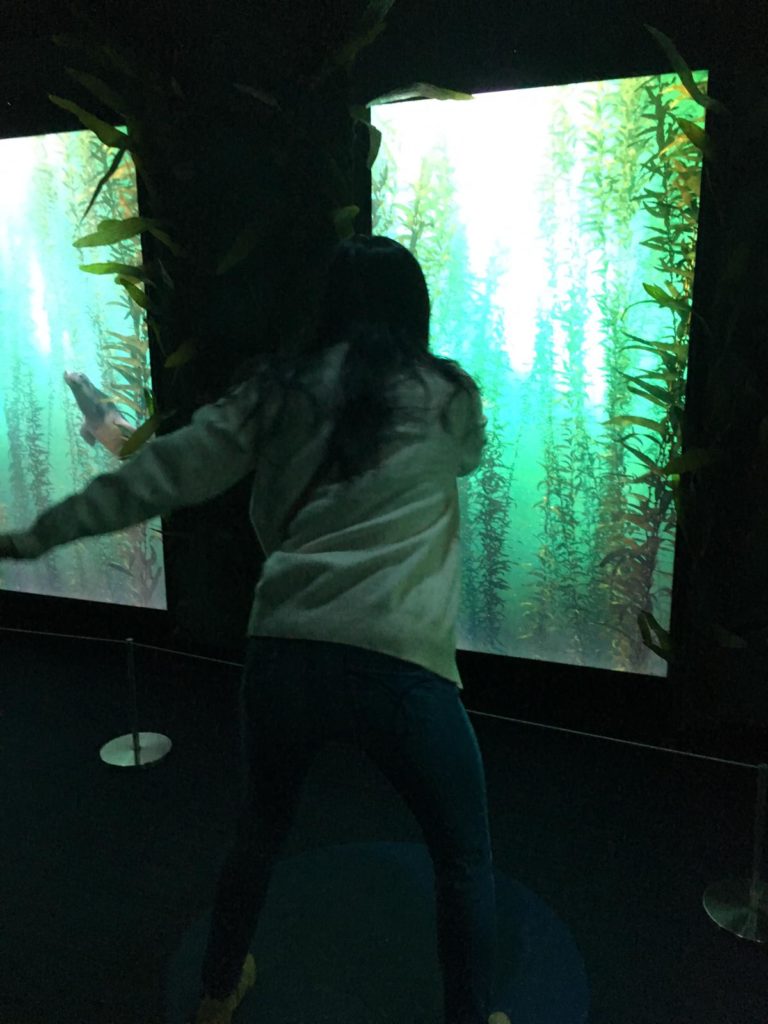
In the sea lion exhibit, our guide demonstrated using the screens to learn about sea lions. Individual users stood in front of individual screens, waving their arms and watching the sea lion swim in corresponding movements.

Traditional displays sadly forgotten

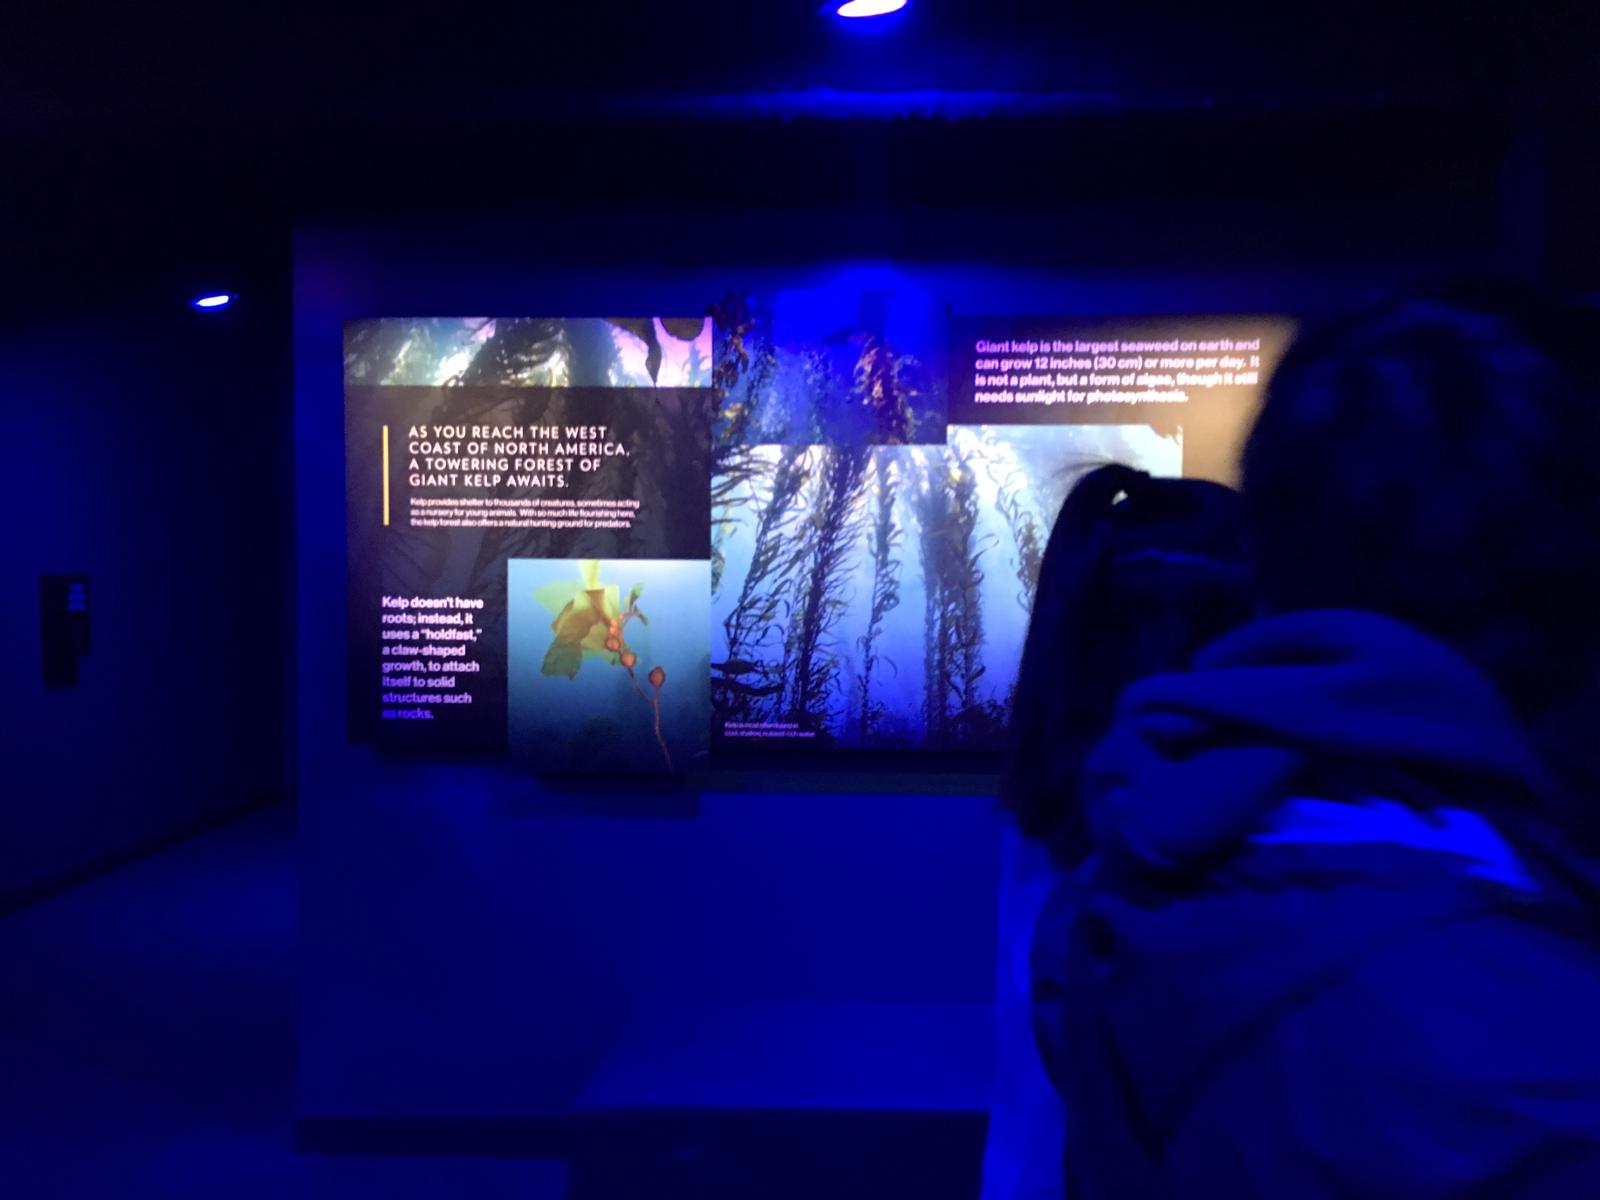
Unlike a traditional museum environment where static images and text are the bulk of the information, in this experience, they were peripheral. Unless the guide purposefully drew users’ attentions to non-digital image and text, they were largely ignored.

Perhaps a better designed information environment would make a more seamless transition between information that is digital presented to users, and traditional forms of information like posters and displays. Compared to interactive and immersive digital elements, traditional static visual graphics were much less interesting to users.

Quizzes and games

At the end of the exhibit, our guide led users into a room with many different games and quizzes on ocean ecology and conservation and allowed us to interact with them independently.  Most of these activities were screen based, apart from colouring sheets which no users used.

Users interacted with different screens equipped with pressure, laser, and gesture sensors, making each game interesting and different. Adults and children alike were captivated.

Reflection

I think the Ocean Odyssey experience was a really well designed information environment which allowed users to experience information in a fun, experiential, and dynamic way. It proves that learning doesn’t have to just be cognitive and challenges traditional approaches to learning by allowing users to engage with information physically and emotionally. I think this kind of experience, when curated as well as the Ocean Odyssey, can have great impact on education and edutainment.

But I’m not sure whether or not the information environment was designed with affordances in mind. Users were guided by a trained guide throughout, and were given instructions on how exactly to interact with each aspect of the experience. Of course, interactive experiences that blends digital with the physical are still very new so there isn’t as yet an established semiotic system that can allow users to know exactly how to interact with exhibits without a guide. I can imagine, in future, when more experiences incorporate interactive digital elements in physical spaces, there will be a need for the design of a standardised semiotic system that is well understood by the user to act as navigation.

References

Norman, Don. The Design of Everyday Things. New York: Basic Books, 2013.

Observation: The Fairway on E 86th

INFO 601-02 – ASSIGNMENT 3 – OBSERVATION – MADDY NEWQUIST

The first item on my list was lemons and I found them easily; then I turned up another aisle, and there were more lemons—ostensibly the same kind, but a different price. And although it was easy to realize that I had simply been moving too quickly and had initially grabbed organic lemons by mistake, it did make me start thinking about signage (and consumer traps!) and how the shoppers in a grocery store interpret that signage, and so the setting felt appropriate for this blog post about the observation of an information environment. I returned to the store a couple weeks later to view it as both a shopper trying to make the most efficient use of their time and an observer taking notes on how well I was able to accomplish that task.

Physical Layout

Constraints on the environment are perhaps owed to the fact that this is a two-story store with the check-outs and the exit existing only on one floor—the same as the entrance. And while this is an unchangeable feature of the space, it is absolutely necessary point out how well the internal staircase is camouflaged. (Three elevators line the back wall, but who has the time?) There is one sign and it is easy to miss, especially as it is positioned well above most people’s line of sight and is only marked on one visible side. It also only makes note of the meat and fish departments being downstairs, ignoring two larger details: (a) that it is pointing to/at stairs and not just informing people that somehow they need to get downstairs, and (b) that all departments save those for produce and cheese were located downstairs.

Consumer Navigation

I couldn’t find the peanut butter. I’d waited too long to ask for help and I wasn’t going to fold now—for whatever reason, I needed to prove that I could do this in spite of my resistance to ask for or seek out help at the beginning of my search. Doesn’t that sound familiar? Kuhlthau’s Information Search Process, although primarily applied to students in a paper-writing capacity, felt like an apt lens through which to view my, and really anyone’s, travels and travails through a grocery store:

At initiation, I recognized the need for new information so that I could complete my shopping: I had to know where things were in this particular store. At selection, I picked items on my list to begin searching for as a way to become familiar with general navigation. Exploration and formulation were the biggest obstacle for me, as well as for Kuhlthau’s original study subjects, and I could only reach stage five’s collection after asking an intermediary or finally locating signage directly relevant for my search. I achieve search closure at both the location of each object on my list, and in the check-out line.

Although upon looking back it maybe shouldn’t have surprised me so much, but I did find it surprising how little interaction there was between user and digital technology, unless it’s through an intermediary—cashiers, or employees weighing meat or fish behind counters. Intermediaries were available during the shopping experience and it was at the discretion of the shopper-user to seek them out. And although there were more employees (and all willing to help) visible than at other grocery stores, none were there just to help direct users.

But with the sheer amount of signage, despite whether or not each sign actually imparted information, it felt like the store was saying to its shoppers: Why would you need us to help you? Can’t you figure it out yourself? Look at all the signs we made to make it easy for you!

Suggestions

My general difficulty with navigating this information environment came from the overwhelming proliferation of signage. Without sacrificing the necessity of grocery stores to send their users on a bit of a wild goose chase in order for them to stock up on items they may not have on their original shopping lists, I would suggest a focus on these three action items to start:

  • A better typographical system: while real estate on an individual sign is limited, it is even more difficult to decipher when categories are formatted as run-in lists, separated only by commas, rather than by columns which are easily deciphered visually.  The size of the font is also difficult to read, and it felt that the aisle number was given superficial importance over this.
  • Often supermarkets will have a general index attached to the end of each (or every other) aisle, which serve as a quick guide for both employees and users. An info guide such as this, or a blueprint map by department (similar to the ones they have in IKEA stores), would be a helpful addition to a user’s experience.
  • A clearer labeling of store staples with a typography setting it apart from the other signage would help call out the stairs, elevators, checkout lines with restrictions (e.g. “15 items or less”), and even the entrance and exit.

Reflection

This observation setting could explore Buckland’s information-as-process (reading and interpreting signs to varying degrees of success) definition, but it is also an interesting look at how an information environment assumes certain inherent knowledge or ability to navigate its internal system from its users. While I’m not sure I can quite claim “hard-to-reach users” as a factor here, there are some barriers to entry (or at least to efficient use of the space), with increasing specificity: (a) knowledge of how grocery stores are generally laid out (i.e. produce near the entrance); (b) knowledge of how Fairway (or other chain brand) stores are generally laid out; and (c) knowledge of this specific [Fairway] location. This relates back to the first two stages of ISP, and can further be applied to suggestions for improvement. Through this observation, I gained a greater appreciation for the balance retail businesses must maintain between helping and leading astray their users; and I am convinced that there is a way to stabilize that balance without sacrificing one or the other.

References:

Buckland, M. K. (1991). Information as Thing. Journal of the American Society for Information Science, 42(5).

Kuhlthau, Carol (2004). Seeking Meaning: a process approach to library and information services. London: Libraries Unlimited.

For further reading on grocery stores as information environments:

Ocepek, M. G. (2017). Passive information behaviors while grocery shopping. Proceedings of the Association for Information Science and Technology, 54(1), 507-510. doi:10.1002/pra2.2017.14505401058

Observation: @ JFK Airport JetBlue Airline

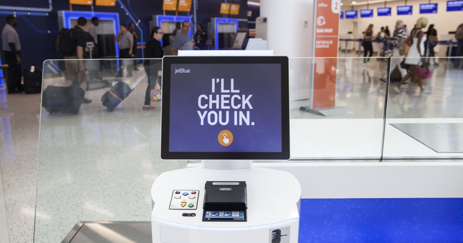
My observation took place during the night time at the John F. Kennedy International Airport. I was taking a best friend to his flight that was leaving at 11:45 AM. During the time at the airport we were trying to check-in as fast as possible because traffic has made us run late. When checking-in there weren’t that many staff attending customers on the JetBlue Airline. We believe that the staff was low because of the given late-night time. I remember there was a time that JetBlue had a lot of staff but that was during the morning and afternoons. Since my friend was leaving so late at night to go to his destination, he was having trouble in getting on board as fast as possible. He was running very late and too many people were causing delays that he couldn’t wait for a staff. He then decided that he wanted to use the self-service check-in with JetBlue kiosk. My best friend thought that it would be a faster to be able to check in through self-service system and won’t be able to wait on line for a long time.

The kiosk self-service machines were close by the where you check in with the staff. They were at a good spot where users can easily access it. If I’m not correct I believe there were about ten machines or more and most of them weren’t being used. The kiosk machines had a big touch screen for the users to use and be able to see the features and content that the check-in service provide. The kiosk machine also had a slot where you put in your passport so that it can scan it for ­its check-in purposes. My best friend started using the device but he wasn’t exactly sure how it worked. He decided to get help online through google. He had made his search on how to use the check-in self-service and had gotten a lot of information on videos and article on getting help. At the moment of his search he was able find something that helped him understand how to use the device at JetBlue airlines. The information he gathered only took him about 15 minutes of his time to be an able check-in with the machine successfully.

The kiosk machine was pretty much straight forward for him to use, but he was mostly having trouble in how to scan the passport the right way. I believe that the machine wasn’t telling the him how to properly enter the passport in the right way because the screen basically shows a 3 second video on how to do it. I believe that tip that device gives you to scan your passport is helpful but there should be a little more information added to the screen to help the user scan its passport. For example, if the kiosk machine was to show a set of steps of instructions while viewing the small clip that shows you how to scan your identification it will get the user to properly be able to do what is asking to do. I remember that my best friend was getting a little frustrated because he tried about three times and since he was running late to his flight, he wanted thing to get done fast. 

There are so many digital devices out there that even airports have self-service check-in for flight. All these devices are connected by a network and they all give a scalable feature to its users for simplicity and helpful use. Just like the website of google that helped my friend get the help he needs for to this digital device, it had provided him with so much information about the kiosk. These many information helps with the leading of new development. As Gary Marchionini writes in his paper of Human-information interaction research and development,

“Digital technology has created a plethora of new kinds of information objects, including multimedia combinations that exhibit behavior, acquire history over time, and lead to new emergent properties. When these objects are Web-based, they acquire a scalability feature that leads to new kinds of emergence: interactions among millions of people and trillions of machines cycles create new kinds of information objects defined by instantaneous states of the network.” 

Observing and experiencing what my best friend went through to check-in with the kiosk device at the airport gave me knowledge. The specific understanding, I had gotten from my observation was that it thought me how the information that my friend gathered was helpful in the way that he was able to understand and use the newly self-service device from JetBlue. Just by searching up a question.

Reference

Gary, M. (2008). Human-information interaction research and development. Library & Information Science Research, vol.30, 165-174. doi: 10.1016

Event: “The Techonomic Cold War With China”

DESCRIPTION I attended an event hosted by Intelligence Squared. It was a debate on the topic “The Techonomic Cold War With China”, and it addressed questions about which country will host the future technology stronghold.

INFO 601-02, Assignment 3. By: Erik Hannell

Technology is one of the most important elements of our modern society. Major technological developments have generated e.g. better healthcare, a cleaner environment, and more lucrative businesses, which in most cases have led to an improved world. The country with the most accelerating and advanced technological environment holds a great advantage, in regards to societal, as well as economic measures. There is a rather unanimous agreement of that the current technological mecca is located in the US, more specifically in the well-known area of Silicon Valley. However, there are split opinions on how much longer Silicon Valley will maintain its glorified status. Some are arguing that the future technology stronghold could possibly be situated in China.

WHAT HAPPENED? On February the 25th, 2019, Intelligence Squared hosted a debate on the topic “The Techonomic Cold War With China”, which addressed the split opinions about the future technological mecca mentioned above. Five experts within technology, economics, and politics presented their opinions for three questions, succeeded by an argumentative discussion. The participants were; Ian Bremmer (founder & president, Eurasia Group), Michèle Flournoy (co-founder and managing partner at WestExec and former U.S. Undersecretary of Defense for Policy), Yasheng Huang (professor at M.I.T Sloan and author), Parag Khanna (founder & managing partner, FutureMap) and Susan Thornton (senior fellow, Yale University, and former assistant secretary of state for East Asian and Pacific Affairs). The questions were; will the next Silicon Valley be located in China? Is the belt and road initiative a trillion-dollar blunder? Will the U.S. and China both lose the trade war?

All participants gave profound arguments and contributed to interesting discussions. They were all united about the fact that China is superior in one specific matter; they possess a lot of data. Furthermore, all debaters agreed upon Bremmer’s (2019) statement that “data is one of the most valuable assets in today’s society”. Another strong argument in favor of China was when Huang (2019) pointed out that China is a heavy investor in artificial intelligence, which is expected to in many ways revolutionize our society. Considering the significant investments in artificial intelligence, as well as the vast possession of data, China should be regarded by the USA as a severe threat in the competition for hosting the future technology capital of the world. However, as the debate unfolded, Thornton (2019) argued that China’s heavily restrictive policies prevent them from surpassing the US. She implied that, as long as China operates in a closed ecosystem, they will have a difficult time catching up with Silicon Valley. In addition to the disadvantage of having a lot of restrictions, Yasheng (2019) meant that China’s nature of being an authoritarian state is also a counterproductive factor in the race for becoming the new technology stronghold.

REFLECTION Data makes the foundation of the DIKW-pyramid (Ma, 2012). It is the main source of what becomes information. Hence, considering China’s vast possession of data, they have strong opportunities to generate wisdom. For wisdom is generated from knowledge, which is generated from information, which is generated from data.

The statement that Thornton (2019) made in regards to China’s difficulty of surpassing the US because of their restrictive policies made me think of how Lessig (1999) points out the advantages of open code, i.e. allowing everyone to participate in the development of running code by maintaining a transparent system. Applying the theory of open code to Chinese governing would, in other words, be beneficial and increase their opportunity of becoming hosts of the future technology stronghold. Restricting the work of scientists and researchers, in the frame for what is legal and morally acceptable, is never going to be a success factor for generating growth and positive development.

Adjunct to the restriction discussion above, McChesney (2013) states that media problems in authoritarian states are solved by making the media present news in favor of the dictator. Media is probably the most efficient tool for affecting the opinions of large amounts of people. Although not directly connected to technology, the authoritarian governing generates an indirect impact as it reduces interest from talented individuals and forefront technology companies to work and perform research in China. Democracy is essential for any thriving society in today’s world. This supports Yasheng’s (2019) statement of China’s harmful authoritarian governing. To add to this reflection, an authoritarian way of operating the media generates a situation where people receive biased news and information. Hence, residents and citizens of China could be defined as information outsiders (Chatham, 1996). Clearly, adding up to the contradictory arguments for a possible future Chinese “Silicon Valley”.

Conclusively, attending this event and reflecting upon it, made me realize the importance of open code and democracy in a society, not only in regard to its obvious benefits, such as equality but also in terms of competition as to who will become the next technological power.

REFERENCES

Chatham, E. (1996). The Impoverished Life-World of Outsiders. Journal of the American Society for Information Science, 47 (3): 193-206

Intelligence Squared. 2019, February 26. Techonomic Cold War with China. [Audio podcast]. Retrieved from https://www.intelligencesquaredus.org/debates/unresolved-techonomic-cold-war-china

Lessig, L. (1999). Open code and open societies: values of internet governance. Chicago Kent Law-Review 74, 101-116.

Ma, L. (2012), Meanings of Information: The assumptions and research consequences of three foundational LIS theories. Journal of the American Society for Information Science and Technology, 63 (4): 716-723.

McChesney, R.W. (2013) Digital Disconnect: How capitalism is turning Internet against democracy. New York, New York: The New Press.

Link to event: https://www.intelligencesquaredus.org/

Digital Life Seminar Event: Microsoft President Brad Smith on Facial Recognition

INFO 601-02 ASSIGNMENT 3: EVENT ATTENDANCE BY MICHAEL LEWIS

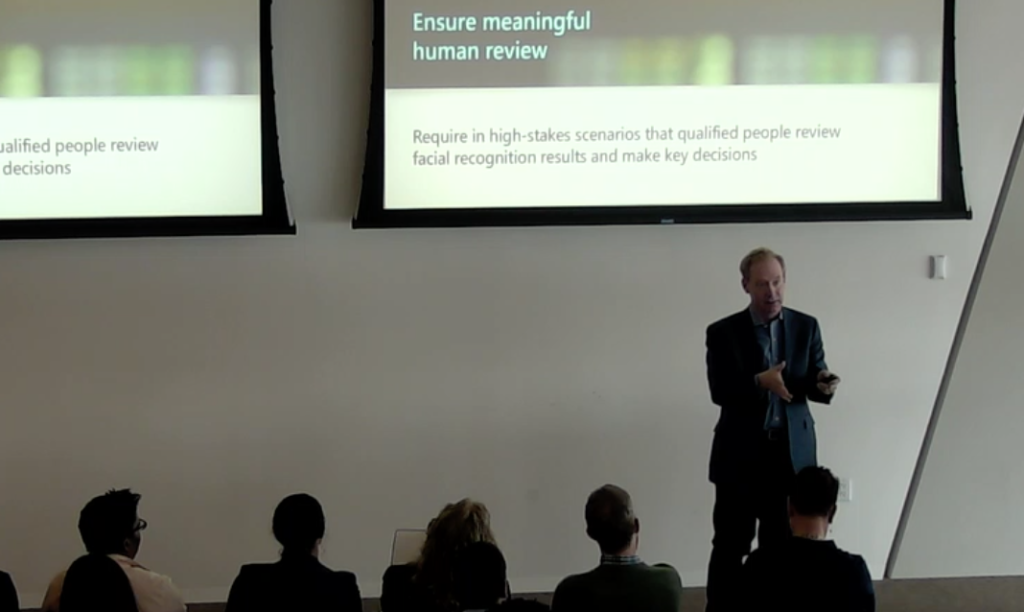
Having an interest in inclusive design by Microsoft, I decided to go to the Digital Life Seminar event curated by Cornell University. The topic of the seminar is Facial Recognition: Coming to a Street Near You. The special guest that will be talking in this event is the President of Microsoft, Brad Smith. The Digital Life Seminar is a weekly event produced by internal members of Cornell University, which also invites different special guests every week.

Source: https://www.dli.tech.cornell.edu/blog/brad-smith-facial-recognition

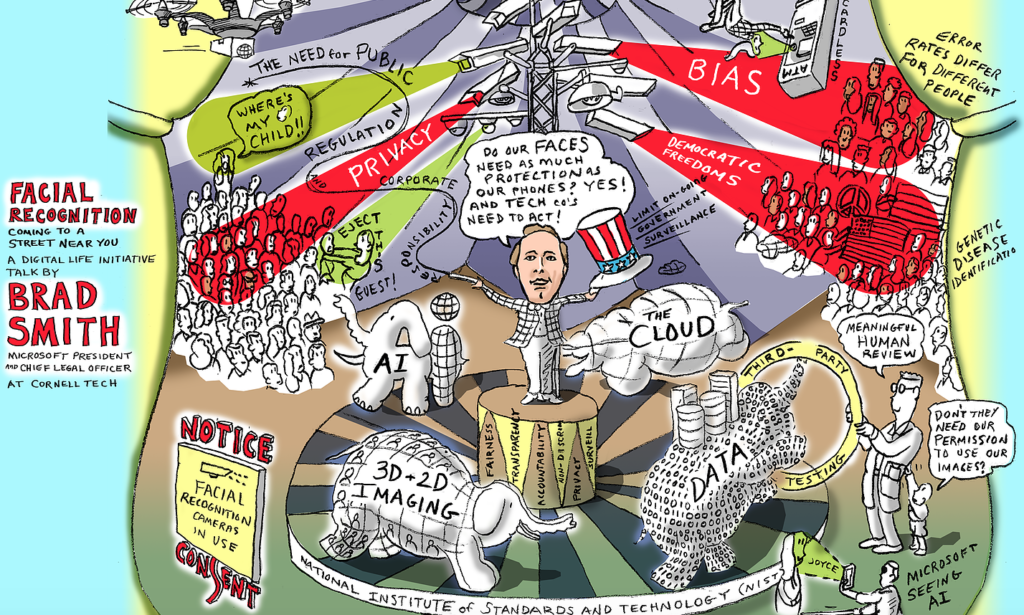
The Seminar started with one of the faculty of Cornell introducing the topic of the day and welcoming Brad Smith to the stage. Brad began the seminar by explaining the very basic definition of facial recognition. He believes that facial recognition to human, is a natural skill that developed over time since the very first day of our life in this world. Facial recognition is also one of the examples of information behavior, preferred term used to describe the many ways in which human beings interact with information, in particular, the ways in which people seek and utilize information (Bates, 2010). A human does not need technology nor an algorithm to recognize different faces every day; however, it takes decades for a human to create a technology that can catch up with human and able to do facial recognition.

Facial recognition is possible today because of the technology development like improvements to 2D and 3D cameras, increased computational power in the cloud, increased availability of data and AI algorithmic advancements. Brad mentioned that technology today could mimic facial recognition ability because innovators realized that facial features could be calculated by the mathematical equation, e.g., the distance of our pupils, the shape of our nose, and the bend of our smile.

Australian Bank has already created a prototype to test this feature by using automated teller that can do facial recognition so that customers do not need to go to the bank to verify their identities. The police department in India also has been using this technology to help find missing kids. Microsoft themselves also have invented ‘Microsoft Seeing AI’ which can recognize an object/ a person, what kind of object/ who that person is with a single camera to aid people with visual disabilities.

In looking at this, Brad also explained to the audience that there is always a downside to this emerging technology. He mentioned that there are broad potential issues caused by facial recognition which are the violation of privacy and risk of bias. He stated, “If society does not think harder and take real steps to manage this technology, there will be no way to avoid the commercial race to the bottom. Everyone will sell everything to everybody, everywhere in the world, and we will come to regret it.” He realized that we as a society have to be aware and not taken for granted due to this development of new technology.

In terms of privacy, Brad forecasts that facial recognition will level up its game where it is possible to walk in a retail store, and have a camera facial recognized customers throughout the store in the future. It will be able to follow customers where ever they go and see everything that they picked up to analyze their behavior. One way to tackle this is for retailers or space owners to notify customers when their pictures are taken and used for facial recognition purposes.


Although facial recognition technology has been growing exponentially, it still has its flaw and error rates. “Almost every computer system has error rates,” he explained. In looking at this, it is known that the error rates on facial recognition weights more on women and people of color. This has something to do with the fact that most of these technologies are created by men, who are mostly not aware of these issues. Furthermore, customers are avoiding products that are not universal and has a bias element to it. The potential solution to this issue is to enable third-party testing to make sure that facial recognition is accurate and unbiased.

To shed some light, Brad believed that technology companies should help to address these issues. He promised that Microsoft would participate with this movement and apply six principles towards facial recognition technology which are fairness, transparency, accountability, non-discrimination, privacy protection, and lawful surveillance.

After attending this Digital Life Seminar, it made me realize that I have to put more attention on the technologies and data that I provided to the technology. Data means “things that have been given.” It is, therefore, an apt term for the sort of information-as-thing that has been processed in some way for use (Buckland, 1991). In looking at this, I believe that we as a society should be smarter in managing our information and data that is being used in technology, to avoid any violations of privacy.

References:

Bates, M. J. (2010). Information Behavior. Encyclopedia of Library and Information Sciences, Third Edition, 2381.

Buckland, M. K. (1991). Information as Thing. Journal of the American Society for Information Science, 42(5), 353.