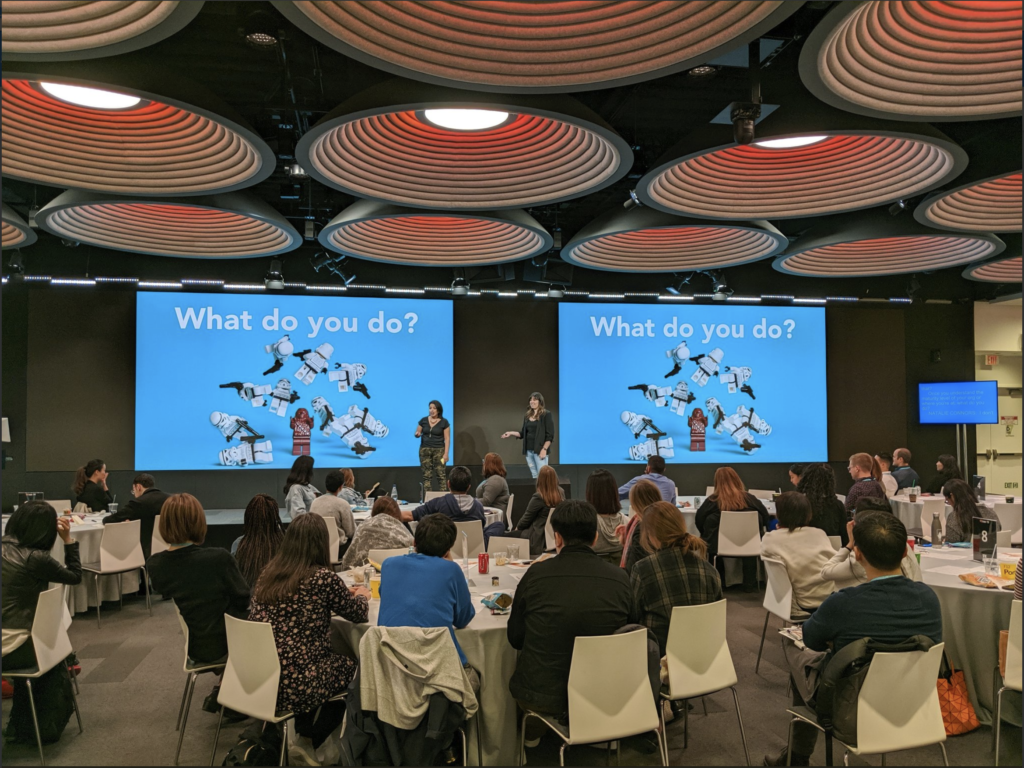
As user experience design continues to be identified in almost all fields of media, technology, and architecture; it’s an investment to understand how this field works and the different ways users can be reached from other perspectives. Apps, formally referred to as applications, are used daily to help users achieve a sense of satisfaction depending on the app utilized. For example, they can simply help with setting reminders or keeping us close with loved ones. One aspect that most users aren’t familiar with, is the many ways apps are created from the ground up. According to Norman information and the beginning of design comes from the brain, “One of the challenges, that the brain does not work at all like a computer, also provides us with an opportunity: the possibility of new modes of interaction that allow us to take advantage of the complementary talents of humans and machines.” (Norman, 2008). Lego Series Play is a collaborative problem solving methods used for designing apps, buildings, and other areas of design. Lego Series Play is a design software that is used to help designers build with empathy, focus on user needs, fix problems, and allow opportunities for new designs. While attending this hands on event there were moments when I the designer felt a deep connection with my build and how the director was able to make myself achieve a deeper emotion and connection through my design.
To gain more of an understanding of what we were doing in this workshop Heidi Brant gave each student a pack of legos. Each pack had the same set of legos found within them. Her first instructions were to use the legos and build a bridge with only rule: to make sure that our hand would be able to go under the bridge we built. We then had to modify our bridge based on how we were feeling at that exact moment. Whether we were happy, curious, or intrigued by what was happening that day. On top of the last modification we had to modify the bridge again based on a division in life that we felt. Whether if it was being homesick, losing a friend, or losing a loved one. This allowed the designers to work and create with empathy to focus on users needs to fix problems and allow for opportunities of new designs. Based off of all the design modifications we did, we now had to collectively work as a group to create an app. We were given a blue base to build on using legos to describe what the app will do and what features it will have. “Wireframing: Sketch your project’s form and interface without focusing much, if at all, on content. Wireframes provides a good sense of how people may interact with your project, and they don’t require any programming. Additionally, there are also opportunities to talk about scope and feature creep (before the project is too far along)” (Jentery Sayers). Lego series play is a different type of wireframing and prototyping. It Isn’t technical, it’s a more physical approach, such as a sketch but instead you are building it out. You have a different visual representation or your app that you are making. For our last build there was a more focused approach into a specific setting for user experience design. Each group was given a task card, our group had to redesign the experience of air travel with small children. We first individually came up with our own ideas on what we could do to improve air travel and we all had a similar approaches. We thought about the aggravation that flyers get when a baby would cry or a child kicking the back seat. We came up with an approach of creating a daycare area for kids, where they would be watched and monitored by flight attendants. Inside of this daycare, children would be able to use different interactive play fields where they can pretend to be flying the plane that they are on at that time and view what’s happening from outside. These designs came from our own personal experiences, all focused around designing with empathy. This was my first time sitting in on a workshop for User Experience design. This opportunity gave me something that I myself as a designer will look forward to gaining more knowledge about this technique in my future design making. My takeaways from this workshop was designing comes from experience, what yourself and others have gone through. The Negatives that can come out of Lego Series Play can be designing for people who lack a sense of visual, how can you create surrounding their needs visually. I hope that through this workshop we learned how to deal with multisensory designs and better UX designing for blind, and deaf users. Lego Series Designing is on a kindergarten level in the USA compared to places in Asia and Europe. It’s fairly new so I’m curious to see where it goes in terms of influencing design in the US especially major cities.
I attended a panel discussion called Transforming Designers – Not Just Another Working Day. The idea behind the event was to reflect on how the role of designers is changing in modern contexts since designers are no longer limited to their studios and a wide range of organizations are now developing their in-house design teams. The event was part of a series organized in collaboration between the Service Design Drinks Milan and NYC Service Design Collective which are groups of volunteers who bring together service design academics, professionals and enthusiasts.
The event was hosted at Foursquare.
I had two big reasons why I was drawn to this event. Firstly, I decided to pursue graduate school in the field of design because I believed that public service delivery in my home country of Pakistan needed to be improved through the principles of human-centered service design. So I was curious to hear how service design had fared in the US especially in the public service domain. Secondly, since having started graduate school, I had begun to study the emerging issues of science, technology and society, such as issues of algorithmic bias, surveillance capitalism and digital labour. I had also recently attended a talk on AIGA’s Design Futures project which proposed the idea of ‘environment-centered design’ which is design driven by core values for good. I was pondering over whether these discussions that were happening in academia also resonated with the industry and whether they influenced the professional designers.
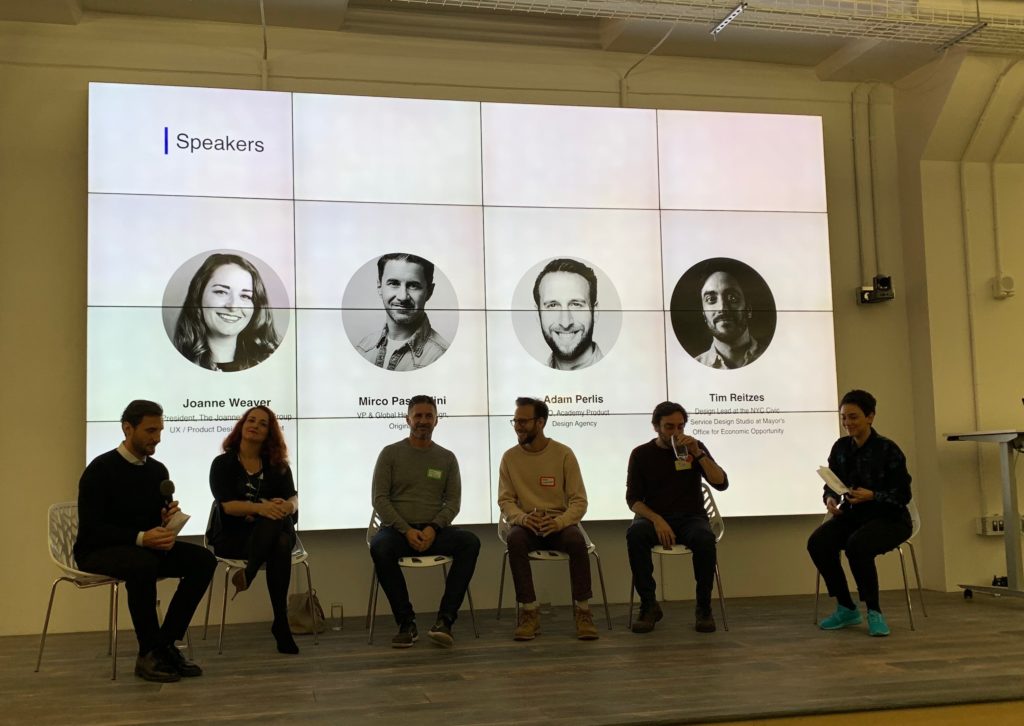
The panelists for the event were:
Joanne Weaver
President, The Joanne Weaver Group – UX / Product Design Recruitment
The discussion followed five main topics which the panelists addressed one by one.
Are designers leading?
The major consensus was that up until a few years ago designers would get pushed around by product and engineering but in the last few years however this has changed a lot in the last few years. Designers are increasingly being seen as change-makers and ‘internal consultants’. Firms have identified the value of their insight. Senior designers are now applying their concepts of design to the designing of organizations and processes. However, on the public administration end this is still harder to do because of bureaucratic red tape. The takeaway was that designers need to identify the value they can create beyond their skills of design and drive this change themselves.
Given the new roles of designers, what new design skills or areas of study are emerging?
“Design Strategist” is becoming a popular position that companies are hiring for. What they are looking for is basically a hybrid of UX researcher, digital strategist and information architect. A good reflection of this trend is that even McKinsey and Company are hiring for this position in their consulting teams. Voice Experience (VX) design is another upcoming skillset and position as voice interface and assistants become popular.
“Co-creation” is also a skill that’s being sought after, especially in the public service domain. All the panelists emphasized how valuable it is for a designer to know how to manage a co-creation process and how difficult it is to pull off. Adam Perlis gave the example of his company’s approach of trying to “be in bed” with the clients by working in their offices, pairing up with actual employees and shadowing and sharing the actual work. Tim Reitzes talked about the difficulties of convincing public service stakeholders of the value of co-creation.
Another point under discussion was that its a challenge for designers to apply for these new roles because of their legacy job titles. There was some consideration that designers should just give themselves the title they want based on the actual work they are doing. Joanne Weaver being the recruitment expert here suggested that designers can add subtitles to their resume but the actual title should remain the official one.
How do you measure the value of design?
All of the panelists agreed that this is a difficult question to answer in most circumstances. It’s the “white whale” of design, everyone is looking for the right answer but no one has figured it out. However, the general agreement was that KPIs are important and they should be chosen on a case-by-case basis. Some additional metrics may also be needed such as ‘how many opportunities did you create as a designer?’ or ‘how many minds did you open?’ with the focus being capturing the impact the designer has had.
Data & creativity – which drives what?
This is where I was most surprised by the position of the panelists. The question was in your design process, do you first start with your creativity and come up with some out-of-the-box concepts and then validate them using data or do you first use the data to find the biggest problems and then use your creativity to solve them? I expected the panelists to say that it’s a bit of both but they had a consensus that it was important to start with the data first. This is the most efficient or cost-effective way.
What is the role of ethics in design today?
All of the panelists agreed that it’s become very important for designers to understand and be aware of the ethical implications of the products they design. The panelists highlighted how technology is influencing our social fabric, there are dark UX patterns everywhere and attention is the new currency. The panelists urged designers to think and list out all possible unintended consequences of their design decisions and the long term sustainability of the solution. Adam Perlis made a point that often clients may push you away from fairness and transparency and that becomes a very difficult space to manage.
It was exciting to hear that the role of designers is expanding into areas of strategy and leadership. There was a palpable excitement in the room full of designers about the future of products with designers on the decision making table. It’s also quite empowering that the nature of this expansion of the role of designers largely lies in their own hands. Apart from that, it was also encouraging to find out that the industry professionals were also eager to think critically about the impact technology is having on our society and they acknowledged the severity of the major issues which need to be addressed.
On October 14, I attended an Alumni Panel hosted by Pratt’s School of Information. The panel consisted of three recent graduates from the School, each in different roles in the information community. They were: Carlos Acevedo, the Digital Asset Manager at The Jewish Museum Kate Meizner, a UX Designer & Data Analyst at Google Anna Murphy, an Upper School Librarian at the Berkeley Carroll School, an independent school in Park Slope.
ASIS&T @ Pratt, the Association for Information Science and Technology, put on the panel in conjunction with Professor Irene Lopatovska’s INFO 601 classes. It was mostly students from her class who filled the room, but there were several other School of Information students in attendance as well. In general, the panel had a very casual feel as it was a small audience in the same room our class is held. The panelists went down the line answering questions about their time as graduate students and their transition into their respective fields. This panel was set up as a way for current students to see how our predecessors have managed to gain careers after graduation and give advice to current students who may be worried or not sure where to go after their impending graduations.
Mr. Acevedo, who has done Digital Asset Management for the Jewish Museum for three and a half years now, began by saying that the first two years of his position were taken up by introducing a DAM system and the last year has been spent managing that system. His team is small and he is the only one managing the DAM on the team. Mostly, that makes Mr. Acecedo’s work independent but he does have a lot of cross-departmental meetings and works closely with the Director of Digital, JiaJia Fei. Ironically, he noted, his project management style is very analog for a position that is so technology-based. To organize himself, he uses a large whiteboard that he splits into different sections corresponding to different tasks he is doing on long and short term bases. Because he meets with so many people from different departments, he makes sure to use formal Google calendar invites to set up meeting times, but uses Slack for more informal communication. When asked what the most challenging part of this job is, Mr. Acevedo noted that there are many projects around the museum he knows he can tackle based on his knowledge of best practices, but often these are out of his control due to departmental lines, budgets, and the will of the Board of Directors. The most rewarding part is when he can solve problems around him that have seemingly impossible solutions.
For Kate Meizner, her position as a UX researcher is very different. She is constantly collaborating with the twelve others on her team, which changes every year and a half. She describes her job as a bit of chaos; her duties range from running two research studies at a time to interviewing customers to surveys, analyzing data, and coordinating team strategy. In the mornings before everyone goes about their tasks, her team does a morning stand-up so everyone can let their coworkers know what they are working on that day, what needs to be accomplished, and who needs to meet to get that done. It can be a challenging workflow, as often non-UX people are invited to make UX decisions. Ms. Meizner also noted the lack of a central project management tool. She utilizes Google Sheets frequently, as well as GoToMeeting which is a remote desktop program, Qualtrics surveys, Tableau, Python, and R. Some current projects are deciding what her team strategy will be for the next two and a half years and analyzing data visualization studies, which last from three weeks to a month. For her, the most challenging parts of her job are new teams which makes finding your place in an organization that is constantly changing difficult, as well as figuring out how to get things done. Yet the most rewarding parts are understanding how research propagates in products, hearing how her work helps others improve their own workdays, and especially when she gets to apply knowledge learned at Pratt.
Anna Murphy’s job is on the Library Science side of the School of Information. As a high school librarian, she has no typical day. Her work ranges from teaching short workshops to students, researching projects for teachers, and conducting an eighth-grade technology class. She is constantly working with children, being centrally located in the library. There is almost no one in the school Ms. Murphy does not work with, so communication is especially important. Many times proposals for projects or workshops are very casual, maybe even just a mention in the elevator, so Google Sheets and Trillo, a task management system, are essential to staying on top of every interaction. For her, the most challenging part of her job is having to advocate for the students first. As an independent school, there is a lot of bureaucracy. She feels she must often work backward from what reading is. However, the most rewarding part is when the students engage with the books she buys for them and feel comfortable in the space of the library.
One of our readings that I was reminded of during this event was John Gehner’s article “Libraries, Low-Income People, and Social Exclusion.“ Especially when Ms. Murphy was talking about how her students come from extremely diverse backgrounds, I felt she was exemplifying what the article says is part of the duty of librarians. Many children who have troubled home lives can find refuge in their school libraries. “Action 3: Remove Barriers that Alienate Socially Excluded Groups” is practiced by Ms. Murphy when she talked about making a comfortable space for her students. She makes sure to not judge them on whatever topic they are interested in, as well as buying books that will pique their interest. She practices “Action 4: Get Out of the Library and Get to Know People” by teaching the technology class, doing classroom visits, and coaching a sports team to nurture a relationship with students outside of the library bounds.
I saw elements of the “Design Justice” article in what Ms. Meizner spoke about. She noted that many times non-UX designers will be on her projects and they fail to see potential problems that she would as someone who takes everyone into consideration, rather than just the mainstream population. She talked about making sure to pay attention to how her work is influencing others, similar to design justice’s mantra of “how the design of objects and systems influences the distribution of risks, harms, and benefits among various groups of people.”
Overall, I found this panel to be extremely helpful in my path through graduate school. It is always reassuring to hear the stories of others who have come before. By hearing how these three graduates earned their degrees, how they obtained their jobs, and how they use their knowledge gained at Pratt Institute in their work every day.
Sources:
Costanza-Chock, Sasha. “Design Justice: towards an Intersectional Feminist Framework for Design Theory and Practice.” DRS2018: Catalyst, June 28, 2018. https://doi.org/10.21606/drs.2018.679.
Gehner, John. “Libraries, Low-Income People, and Social Exclusion.” Public Library Quarterly29, no. 1 (March 15, 2010): 39–47. https://doi.org/10.1080/01616840903562976.
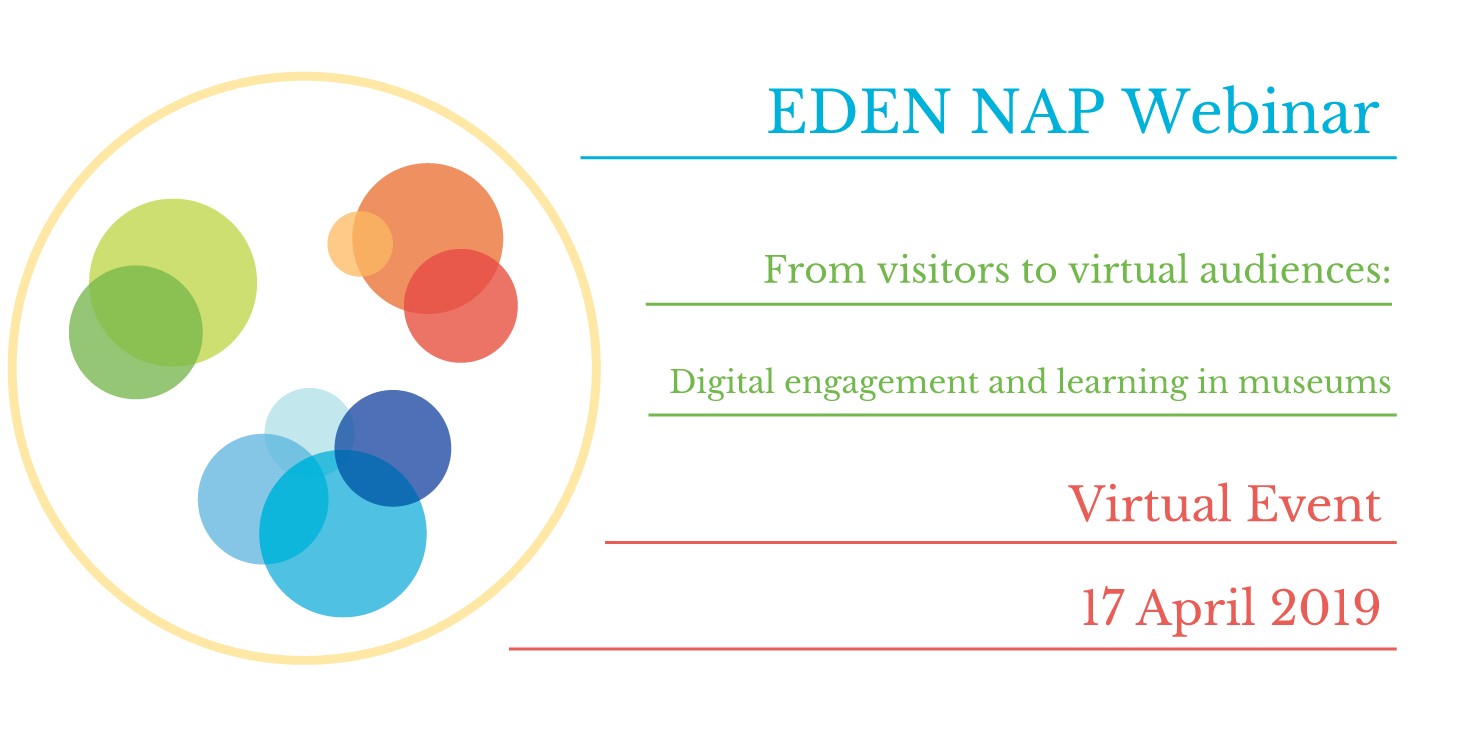
In October 2019 I observed a fascinating EDEN (European Distance and E-Learning Network) Webinar by lecturer Chiara Zuanni. Zuanni is an Assistant Professor in Digital Humanities at the Centre for Information Modelling – Austrian Centre for Digital Humanities at the University of Graz, with a PhD in Museology from the University of Manchester. Her research focuses on museums, digital media and data practices, and the creation of knowledge and its mediation. Zuanni’s most recent published work includes a piece titled “Why Exhibition Histories?” asks how past exhibits in museums can be digitally represented and preserved.
This webinar approached a timely topic with precision, although at times it felt like an introductory course rather than professional development for those already in the field.
Zuanni’s presentation focused on the digital tools and methods that can be used in museums and other heritage institutions to supplement and improve overall learning and education. She began by outlining the social and cultural values of a museum in a table that contradicted the original 101 course feeling. It was overwhelming and hard to absorb, especially when trying to listen at the same time.
Zuanni then went on to develop her thoughts on museum learning. She emphasized that museums were a place to experience and develop interests, yet exhibits were still being treated like window displays where patrons walk away having learned very little. Her example was a visitor survey where guests were asked to draw from memory certain exhibits. Many couldn’t recall accurate displays, or specific details.
Transitioning to her solutions for the problem of stale museum learning, Zuanni introduces the concept of participatory culture and how it plays into most of society. People want to interact with things, whether that be for information or entertainment. When doing so, visitors are more likely to absorb more and leave with a sense that their experience added something to the museum.
Zuanni’s main point in her lecture was that museums have to address visitor experience in order to properly address museum learning. She proposes that digital media is the new way of opening more doors for guests before they even arrive at the museum. A proper website with up to date information and relevant hot links will make the visitors pre-visit easier. Similarly, digital wayfinding will start patrons’ visits off smoothly.
Other examples of enhancing visitor engagement and learning included digital tools such as apps (ie. Brooklyn Museums’ Ask), communicating via social media to encourage conversations with the museum, and using online analytics to predict and react to how patrons use online tools.
Zuanni’s insights show how these modifications to visitor experiences appeal to wide groups, and that they can be more easily researched and understood for future modifications to programming and learning environments. Overall, she highlights a modern theory that the use of digital supplements will bring out new meanings of cultural heritage. This will, as a result, be more impactful on guests.
After observing this webinar, I believe that the addition of digital learning environments and visitor engagement tools will go beyond adding new meaning to exhibits and cultural heritage. These upgrades will allow museums to preserve their exhibits and visitor research for future endeavors.
By preserving exhibits researchers and others interested will be able to observe the information on display in its original dialogue. This may offer perspectives that can be contrasted with future exhibits or current events. Similarly, being able to preserve digital analytics on visitor interactions with the museum will allow museum staff to trace how the institution has changed over time. This will eventually, and hopefully, lead to careful predictions on where the museum should be headed in order to provide the most good for patrons.
Overall, Zuanni’s research, in my opinion, will lead museums into a new age where visitors feel as if they are part of the story being told. In a time when cultural heritage institutions struggle for attendance and funding, projects such as these will be a welcome boost to inspire active learning.
References
Cloonan, Michèle. “W(H)ITHER Preservation?” The Library Quarterly, vol. 71, no. 2, Apr. 2001, pp. 231–242., doi:10.1086/603262.
Dalbello, Marija. “Digital Cultural Heritage: Concepts, Projects, and Emerging Constructions of Heritage.” 2009.
Posner, Miriam. “What’s Next: The Radical, Unrealized Potential of Digital Humanities.” Miriam Posners Blog, 28 July 2015, http://miriamposner.com/blog/whats-next-the-radical-unrealized-potential-of-digital-humanities/.
I watched a Big Data Debate held by the Cambridge Union posted on November 16, 2018, through its Youtube channel. The topic was “big data destroys what means to be human”. This 3V3 debate was very informative and offered me an excellent opportunity to hear the voices from people in different academic or industrial fields about how they think about the pros and cons of the big data and effects on the humanities.
On the proposition side, Jeremy Pitt, the professor of intelligent and self-organizing systems at Imperial College, gave a constructive speech, pointing out that big data facilitated lots of design choices to destroy things what meant to be human. Collecting and analyzing real-time data from people, the big companies would asymmetrically control the means of social coordination, peer production, and digital innovation with little public accountability and transparency. Therefore, it would lead to a global monopoly of just a few players and a few platforms dominating each aspect of social and commercial life. He asserted that in this way, big data destroyed humanities both collectively and individually. Surveillance capitalism emerged and reduced the opportunities for successful collective actions. For individuals, big data diminished human’s ability to create narratives, generate ideas and have unmodified emotions through the algorithms.
Pitt’s speech had many solid points on the current situation, the trend of using big data, and many threats under the emergence of big data. As the first speaker, he lay the foundation for the whole debate on this big data topic. His speech also reminded me of Keller and Neufeld’s book, “Terms of service: understanding our role in the world of big data”, which narrated a world profoundly influenced by the big data. If people shared their data and lived permanently on the grid, they would lose the right to tell their own story. It is terrifying to me, because when everyone in the world agrees to live in a world that uses data to define people, I will have no choice to be a human I want to be.
However, Harry Ellison-Wright, the third-year student from Claire College, disagreed that big data would drive us to that world. He declared that big data would not destroy what meant to be human, but showed people what it meant to be human. Moreover, there were lots of beneficial example of using big data, such as cavendish laboratory, invented vaccinations to save thousands of lives. Even though someone used big data to quantify human’s greed, lust, envy, prejudice, addictions, and darkest secrets, big data actually demonstrated people’s shortcomings and deepened people’s understanding of themselves.
Then, Angus Groom from the proposition side who had a background in economics at Trinity College pointed out that something human owned for a very long time but now under the threats of big data, such as relying on our brains. Then he reemphasized that using computers instead of brains would finally treat privacy, power, and politics. To against Angus, Vesselin Popov, who studied human online behavior and psychological assessment in Cambridge, declared that we need to use big data and also employ precautionary principles. The problems the proposition side accused onto the big data actually were caused by the lack of education, the ability to scrutinize the monopolies, and the regulations on the big institutions to exploit people’s vulnerability. Vesselin claimed that big data did not take away our opportunities to make collective actions. Moreover, e-voting platforms even brought political power to people at a lower level or grassroots level, not only the elites.
After the floor speech provided various examples against each other, Joy Jia, a law student at Queen’s College, and Ken Cukier, a technology editor, had a final round. Joy strongly asserted big data could not be separated from its uses, and big data was valuable did not mean it was harmless. When big data offered people convenience, it also destroyed many vital parts in humanity, especially the emotion. Taking out the emotion out of the decision-making process, the existence of big data impeded human to self-determine, which harmed humanity fundamentally. In contrast, Ken stood for big data was, in fact, a product of our humanity and facilitated us to see further, learn the patterns of the world, and save the world. Also, he disagreed that big data made the power concentrated, because we lived in a world that everything was becoming concentrated.
This debate ended, but the discussion on big data still exists. When we think about the opportunities and challenges from big data historically and broadly, we can find big data is just another turning point in human evolution that our lives have changed dramatically. I agree that “humanity” will develop with social movements. How people behave and think is primarily depended on our resources and limitations. We cannot deny that we are so limited that we need technology to help us live in this world, and big data is one of the most powerful ones that human created to empower ourselves and improve our society. Also, I admit that any superpower can induce the dark sides of human nature, but people should never give up the chance to make the world better because of the potential risks. What we should do is not blaming how big data destroy what means to be human, but finding solutions to protect our humanity.
One floor speaker raised the example of the gun debate, whether it’s the guns that kill people or people kill people. I think this example can lead us to a solution that we should set regulations and make laws on big data issues, just as what we did for the gun. Specifically, to relieve people’s most worrying about the privacy, biased data, and asymmetric control of big companies, one possible solution could be increasing the data transparency that people can decide whether they want their data to be used and learn how their data are used. In my perspective, the most fundamental humanity that can not be destroyed is the freedom to know and choose. In this case, big data technology needs to be encouraged to make more contributions.
As part of the Association of College and Research Libraries (ACRL) Digital Scholarship Section (DSS) Open Data Week 2019, I participated in an open research discussion group: “Open Data Activism in Search of Algorithmic Transparency: Algorithmic Awareness in Practice,” led by Montana State University (MSU) researchers: professor Jason Clark and research assistant Julian Kaptanian.
At the time of the discussion, Clark and Kaptanian were in the process of concluding an IMLS-grant-funded research project entitled “Unpacking the Algorithms That Shape User Experience.” The ACLR DSS presentation built off modules and workshops that Clark and Kaptanian had run in the past year as part of the IMLS research project, exploring how building user competencies and empowering technology users on a personal level is a form of activism. You can learn more about the grant project here.
A ‘Symptom’ of Technology
Clark and Kaptanian grounded the discussion by characterizing algorithms as a ‘symptom’ of routine technology use. Like a cough to a cold, algorithms can be the less than desirable phenomena that shadows the data generated from our daily computer-mediated transactions. However seemingly inexplicable, algorithms have real consequences.
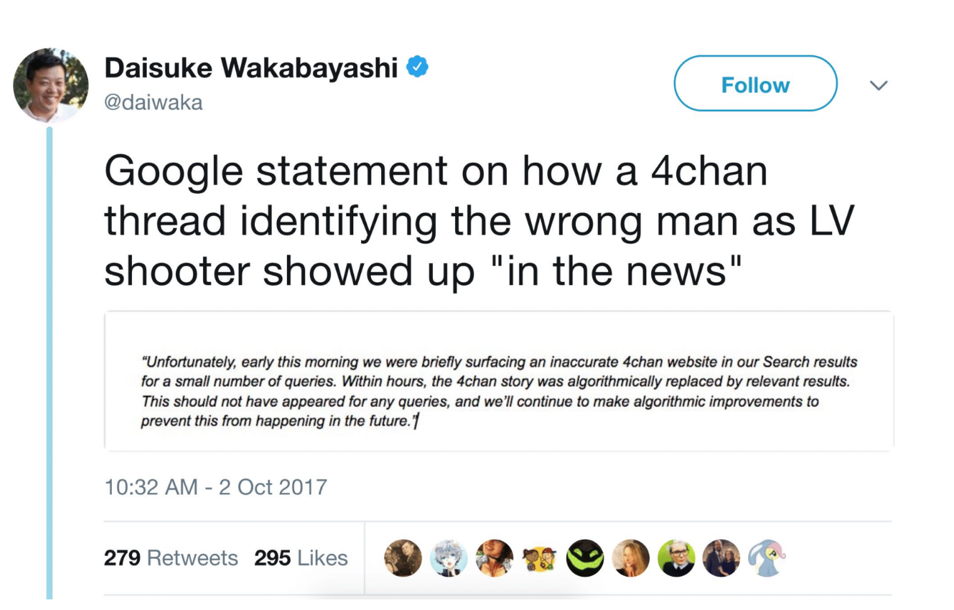
To illustrate this point, Clark recounted how online platforms amplified the incorrect online identification of the Las Vegas shooter in 2017 by pushing 4chan reddit users conspiracy theories in the online search results following the mass shooting. Within hours, an innocent man faced online harassment and blacklisting, an ordeal to which Google and Facebook simply responded ‘the algorithm did it,’ begging the question: what’s behind an algorithm? (Figure 1.)
Clark defines algorithms as the “computational processes embedded into our software” that in turn “predict, recommend, and speculate about our interests” in our all digital interactions. This is to considerable effect and risk as Gillespie warns in “The Relevance of Algorithms,” “as we have embraced computational tools as our primary media of expression, and have made not just mathematics but all information digital, we are subjecting human discourse and knowledge to these procedural logics that undergird all computation.” (Gillespie, 2014, p. 168) Clark then asks what if the “ghost in the machine” was understood by technology users and an “interrogation of algorithms” was a fundamental element of the digital environment? (p. 169)
Open Data and Algorithmic Awareness
Clark grounds this call to action in the EU General Data Protection Regulation (GDPR) “right to explanation” or “meaningful information about the logic involved” in an algorithmic decision. Clark posits GDPR is an international opportunity to demand algorithmic transparency and therefore positions digital literacy as a form of activism.
Clark and Kaptanian led
a series of “algorithmic awareness” exercises that they piloted with MSU
undergraduate students. First, they broke down the core functions of an
algorithm including searching, filtering, ranking, and parsing information through
illustrating the “weighted graph” of how Facebook ranks your connections online
which in turn shapes your Facebook feed, a theoretical concept which is readily
understandable to a user of social media.
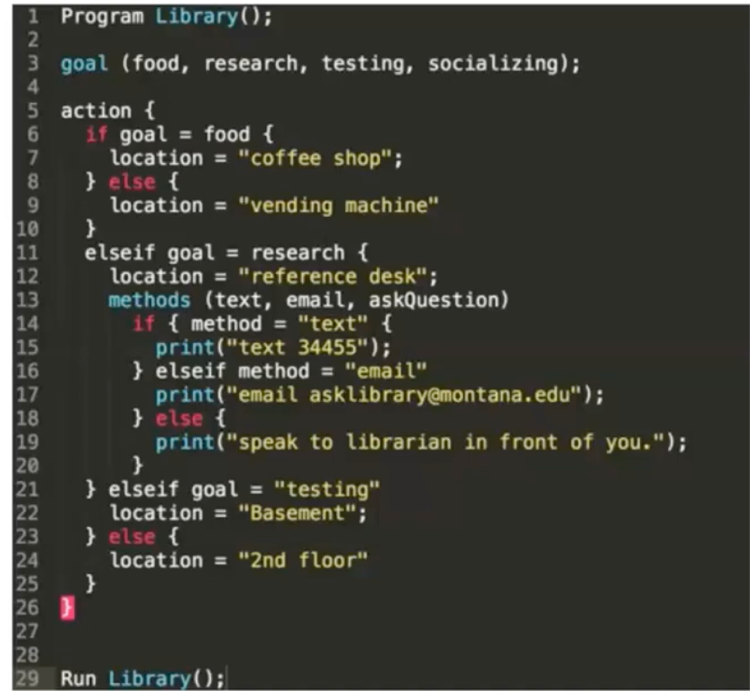
In the next exercise, Clark and Kaptanian aim to demystify the technical aspects of the algorithm by utilizing ‘pseudocode’ through which participants are asked ‘program the library’ or code different goals with the possible actions within a library to reach those goals. For example, the goal of ‘research’ could be achieved by the possible actions: ‘reference desk’ and ‘computer lab.’ They also introduced ‘methods’ as an added layer for achieving the task, like ‘emailing a librarian,’ as a tangible approach to the if, and, or logic underlying all code (Figure 2).
Despite the moderator’s best efforts to explain the technical structure of code through the tangible and familiar spaces of the university library, the exercise in practice proved difficult for the participants, requiring double the time to complete than the suggest 5-7 minutes. However, it was the follow-up questions to the exercise that proved the most valuable in understanding the limitations or code. Kapitanian asked the group who we envisioned as our audience in generating our code and we all answered differently. Some participants envisioned students, other’s faculty, staff or even an outside visitor. Collectively we came to discuss, however bound by brackets and formulaic syntax, our ‘code’ was still limited by our embodied experience enacted within social structures. Therefore, despite their neutral appearance, algorithms and the information they retrieve are subjective (Bates, 2006, p. 11-12).
The presentation concluded with a brief discussion of data profiling, and the steps users can take to understand what personal data is stored in platforms like Facebook and Google by walking participants through how to view and download their digital profiles. For many in the discussion, this exercise was nothing new and limited because their Ad Personalization feature in Google was already turned off.
‘Pedagogy for an Algorithm’
Moreover, the discussion “Open Data Activism in Search of Algorithmic Transparency: Algorithmic Awareness in Practice,” both highlighted the urgent need to build algorithms awareness into digital literacy efforts and while offering tools for educators and students to build that competences and ultimately framing that as activism.
The survey circulated at the close of the event, further emphasized these points. The survey solicited the level of resources and education around algorithm awareness at my current institution as well as asked at what grade level I thought it appropriate to introduce digital literacy.
My response: elementary school, or as soon as students begin to start to seriously engage with the internet.
At a moment when society is attempting to take a step back to fully understand the ‘ghost in the machine,’ it is important to see the opportunity in building digital literacy as a safeguard against current risks and advocate for change or open data in the future.
Wakabayshi, Daisuke (@daiwaka). “Google statement on how 4chan thread identifying the wrong man as the shooter showed up “in the news.” October 2, 2017, 10:32 AM, Tweet.
On Sunday, October 20th
I attended the Radical Networks conference and attended two talks: The Carbon
Footprint of the Internet with Jasmine Soltani and Everything has a Resonant
Frequency: Crystals, Networks, and Crystal Networks with Ingrid Burrington. Both
talks covered a lot of ground (or rather, earth) on the sweeping topic of the
environmental impact of the Internet and the manufacture of its physical
infrastructure by two very broad thinkers whose research has forged ahead in
areas where concrete data is hard to come by.
For clarity and concision, I will focus on my main takeaways from the
first talk, the Carbon Footprint of the Internet.
Soltani began her talk by
explaining the bottom-up approach she and other activists have taken to
calculating the carbon footprint of the Internet in the absence of definitive,
trustworthy sources: identify all the components and processes that make up the
Internet, calculate the energy consumption of each, and identify the energy
sources of each and convert that energy amount to the CO2 equivalent. To date there
still exists no surefire way to calculate the carbon footprint of the Internet,
and therefore estimates of the energy intensity of the Internet diverge by a
factor of 20,000, which can in part be explained by different definitions of
what the Internet is and what it includes (Hilty & Aebischer, 2015).
Current estimates state that the Internet accounts for about 3% of global greenhouse gas emissions (Belkhir & Elmeligi, 2018), which is both significantly less than what I would have predicted and still too abstract to comprehend. For comparison, in Greenpeace’s suspiciously optimistic 2014 report on renewable energy and the Internet, Clicking Clean: How Companies are Creating the Green Internet, the authors state that if “the Cloud” were a country, it would be the 6th largest consumer of electricity on the planet (Cook et al., 2014).
One fact that is generally agreed upon
is that the most energy consumptive element of the Internet is the manufacture
and maintenance of its physical infrastructure, beginning with client devices
(49%), Telecom infrastructure (37%), and data centers (14%; The Climate Group,
2008). For example, client devices, which refers to all of the devices we use
to access the Internet (mobile phones, tablets, laptops, desktops, etc.)
account for the highest proportion of energy consumption; depending on the study,
estimates vary from 40% (Belkhir & Elmeligi, 2018) to 53% of the total
energy consumption of the Internet (Raghavan & Ma, 2011). Most of this energy consumption is due to the
manufacturing phase of client devices (referred to variously as either Embodied
Energy or Grey Energy) and accounts for 45-80% of the total device life cycle
energy (Hischier et al., 2015).
There are numerous complications
with this measure and others like it because not all of these devices are used
to access the Internet 100% of the time—someone can use a laptop to write a
paper, for instance, without ever using the Internet, nor are device lifecycles
consistent across all users—one person can use a phone for 6 months and another
for 6 years. These are just some examples of the nuances that make definitive
calculations about the carbon footprint of the Internet very difficult, if not
impossible. (Ingrid Burrington touches on the difficulties these metrics pose
in her article “The Environmental Toll of a Netflix Binge” in The Atlantic.) I found Soltani’s research commendable
because despite the scarcity of data available and the opacity of the data that
does exist, she has forged ahead and brought attention to this timely topic.
What was also surprising about her
talk—and where she differs substantially from Burrington—is she remains
optimistic about the overall positive impact that the Internet could have in
reducing net carbon emissions in other sectors despite the Internet’s own significant
contributions to global greenhouse gas emissions. While she herself strays away
from a techno-optimist stance, she does cite some suspiciously sanguine (and perhaps
outmoded) views, such as those from an optimistic 2008 report by The Climate
Group: “The scale of emissions reductions that could be enabled by the smart
integration of ICT into new ways of operating, living, working, learning and
traveling makes the sector a key player in the fight against climate change,
despite its own growing carbon footprint,” (The Climate Group, 2008). As an example of this, she mentioned that
teleconferencing takes about 7% of the total energy cost that a face-to-face
meeting would, taking into account factors like different modes of
transportation, etc. (Ong et al., 2014).
She does concede that other
examples of the “dematerialization” of information, including the move from
traditional modes of music and movie distribution to digital streaming
platforms, have less of a positive environment impact: depending on the study,
streaming video is either only slightly more efficient than DVD distribution (Shehabi
et al., 2014), or has an even higher net energy impact that is still rapidly
increasing (The Shift Project, 2019). Whatever the exact figure is, it is
highly impactful due to the fact that video streaming accounts for 64% of all
internet traffic (Ejembi & Bhatti 2015).
The onus of finding environmentally
sustainable solutions to this predicament we are all in should undoubtedly lay
with the tech companies and governments with the greatest carbon footprints,
and not on individuals. If one trusted
the government to oversee the private sector, we could take inspiration from Paul
Ford’s proposal to establish a government agency which he calls the Digital
Environmental Protection Agency, responsible for protecting citizens in the
event of repeated “data spills,” (Ford, 2018). How fitting, then, to also
imagine tasking this hypothetical branch of a rotten bureaucracy with the additional
task of disciplining the tech industry and cleaning up its messes.
Despite the absence of government
legislation and private sector self-regulation, Soltani says that individual
consumers can also take action. Her suggestions
include extending the life of your client devices, using ad blockers (online
advertising is very energy consumptive), protecting your data privacy (the
storing of your personal data is also energy consumptive), and “stream lower
quality videos, I guess,” (Soltani, 2019).
All of these actions, save for electing to stream grainy YouTube videos,
are all actions that have manifold benefits for consumers: less money spent on
replacing devices and less personal data being collected, stored and sold to
marketers and insurance companies at our citizenry’s expense.
While these actions she suggests may benefit individual consumers and make a small environmental impact, they do nothing to challenge the structural logic of late techno-capitalism and its extractivist methodology. Capitalism has always benefited from the dislocation of earth materials from Earth, the dematerialization of commodities and the invisibilization of labor. What is unprecedented at this stage of capitalism is that these existing abstractions of capitalist production have themselves become further abstracted and etherealized in the image of the Cloud. The semiotics of the Cloud further mystifies the terms of commodification and shrouds its mechanics in a blanket of mysticism. Divorcing the Internet from the materiality of the Internet in the image of the Cloud directly benefits the Internet’s profiteers and limits people’s ability to see the ideological machinery at work in their daily lives.
To uncloak this mantle of mysticism
surrounding the Cloud, Nathan Ensmenger proposes treating the Cloud as a “type
of factory” and interrogating it as such:
[W]hat kind
of a factory is it? Who works there, and what kind of work to they do, and how
is it different from the type of work previously performed by factory workers?
Where does it fit in a larger technological, labor, and environmental history
of human industry? And perhaps most importantly, how did it come to be seen as
categorically different? (Ensmenger, 2018, p. 20)
This historical-materialist critique of the Cloud is a
promising start towards resituating the Internet in its material, political,
social, and cultural context. Only by bringing the Cloud back down to Earth can
we begin to imagine a more equitable distribution of power in our
hyper-networked reality.
A Bolivian family at work at a salt mine by Robin Hammond for Daily Mail
POSTSCRIPT
This talk raised many questions I
am still grappling with weeks later. As libraries and cultural centers move
towards digitizing their assets and moving more and more services online,
endeavors often hailed as universally beneficial and in line with our coupled
missions to make information more accessible and to preserve it for posterity, we
do so with little to no heed for how this impacts our shared environmental
future. When environmental collapse comes to a head it won’t matter if our
books are conserved in print format or preserved digitally. As long as the
lifecycles of the hardware we’re using to preserve digital formats continue to physically
deteriorate, and the software we use for the same mission continues to rapidly
accelerate, information professionals are forced to continually endeavor on the
perilous journey of continuous data migration, making us complicit in the whole
system of filling the earth with toxic, obsolete electronic equipment and
mining the same earth yet again for more rare minerals to inaugurate another
terminally obsolete technological lifecycle, ad infinitum. Infinite, that is, until we run out of
minerals.
“Looking from the perspective of
deep time,” Kate Crawford and Vladan Joler write in their essay on the human
labor and planetary resources required to operate an Amazon Echo, “we are
extracting Earth’s history to serve a split second of technological time, in
order to build devices that are often designed to be used for no more than a
few years,” (Crawford & Joler, 2018). All media is an extension of the earth,
be it codices made of paper manufactured from trees which took hundreds to
thousands of years to grow, or be it a PDF viewed on a laptop composed of
lithium, cobalt, and silicon (and the 14 other rare earth minerals necessary to
manufacture a single laptop or smartphone) that took billions of years for
Earth to produce. Where we now differ from Gutenberg’s time is the dizzying
rate of acceleration at which we are moving towards total depletion of the earth
materials needed to produce the information communication technologies that are
embedded in the infrastructure of every branch of daily life.
REFERENCES
Belkhir, L., & Elmeligi, A. (2018). Assessing ICT global emissions
footprint: Trends to 2040 & recommendations. Journal of Cleaner
Production, 177, 448–463. https://doi.org/10.1016/j.jclepro.2017.12.239
Ejembi, O., & Bhatti, S. N. (2015). Client-Side Energy Costs of Video
Streaming. 2015 IEEE International Conference on Data Science and Data
Intensive Systems, 252–259. https://doi.org/10.1109/DSDIS.2015.49
Ensmenger, N. (2018). The environmental history of computing. Technology
and Culture, 59(5), S7–S33.
Hilty, L. M., & Aebischer, B. (2015). ICT for Sustainability: An
Emerging Research Field. In L. M. Hilty & B. Aebischer (Eds.), ICT
Innovations for Sustainability (pp. 3–36). https://doi.org/10.1007/978-3-319-09228-7
Ong, D., Moors, T., & Sivaraman, V. (2014). Comparison of the energy,
carbon and time costs of videoconferencing and in-person meetings. Computer
Communications, 50, 86–94. https://doi.org/10.1016/j.comcom.2014.02.009
Raghavan, B., & Ma, J. (2011). The energy and emergy of the Internet.
Proceedings of the 10th ACM Workshop on Hot Topics in Networks, 9. ACM. https://doi.org/10.1145/2070562.2070571
Shehabi, A., Walker, B., & Masanet, E. (2014). The energy and
greenhouse-gas implications of internet video streaming in the United States. Environmental
Research Letters, 9(5), 054007. https://doi.org/10.1088/1748-9326/9/5/054007
Soltani, J. (2019, October). The Carbon Footprint of the Internet.
Presented at the Radical Networks Conference 2019, New York, NY.
I attended the Radical Networks 2019 conference on a rainy October afternoon. This conference, which centers marginalized and oppressed groups, gathers artists, experimenters, and researchers, and invites them to exchange radical ideas on technology and telecommunications. Conference participants are radical thinkers who want to use technology to help their communities while resisting systems of control and surveillance.
The sessions that initially drew me to this conference were titled “Media Infrastructures and Racialized Territorial Formations: Perspectives from the South” and “Everything Has A Resonant Frequency: On Crystals, Networks, and Crystal Networks.”
These bore a relation to my term paper, which (as of now) seeks to explore the physical aspects and environmental tolls of the Web’s infrastructure. I came to hear the work of a researcher looking into issues of access for the largely indigenous populations in the warmer, tropical, most remote regions of Colombia in “Media Infrastructures.” I came to hear the insights of another researcher and journalist interested in the supply chain of the minerals that power our communications, from World War II-era radios to smartphones in “Resonant Frequency.”
Harm Reduction is Radical
But my attention was captivated by Shamas and Rigot’s presentation on harm reduction, entitled “Looking at the Margins.” To set the context, Norman Shamas began with a definition of harm reduction. Harm reduction consists of practices that ensure one’s survival and aim to minimize harm from certain activities, typically those that are illegal. With the aid of a tweet by @ReyBee10 (2018), they frame it as a term that was “was started by sex workers, queer & trans PoC, people who use drugs, people in the streets saving their own lives and all the intersections thereof—not by public health folks.”
They presented a few examples of community harm reduction practives such as needle exchanges and safer sex education. Central to the idea of harm reduction is the acceptance of pleasure being a normal part of human life. Taking an abstinence-only approach harms by withholding potentially life-saving information. Shamas and Rigot might argue that harm reduction is design justice in motion, as it involves those most affected by structures of domination design their own solutions (Costanza-Chock, 2015).
In addition, Shamas highlighted humanitarian assistance for migrants crossing the desert in the form of providing food and water. Those providing assistance, they said, act in awareness and opposition to structural oppression in that they believe that migrants crossing the border deserve to live. If we are invested in reducing harm, we must shun stigmatization and judgement and work to mitigate risks instead. Harm reduction is inherently radical.
Harm reduction in tech matters because we currently lack a way to bring in systemic support for people that are being harmed while engaging in certain activities—without stigmatizing them. The presenters brought up two case studies to demonstrate methods of designing harm reduction measures and show their effectiveness. My focus is on the first of the two.
Case Study: Queer Dating Apps in Hostile Societies
Afsaneh Rigot, the second presenter, introduced a case study involving queer dating apps in Egypt, Lebanon, and Iran. In all of these countries, queer people are targets of persecution by government officials and fellow citizens alike. Of course, criminalizing sexuality has never prevented queer people from seeking and enjoying love. They have endured despite the risk of arrest and abuse.
The team at Article 19 sought to learn about queer dating app users, their needs, and design harm reduction solutions around these needs. Taking a design justice approach, they worked with local groups in Egypt, Lebanon, and Iran to get a sense of the environment on the ground. As they embarked on their research, the team understood that “the full inclusion of people with direct lived experience of the conditions [they were] trying to change” was crucial, to use Costanza-Chock’s words from “Design Justice.”
User Interviews Yield Revelatory Findings
It was established early on that participants in these countries had no interest in quitting their dating apps despite the risks, so proposed solutions had to support continued app use. Rigot pointed out that elsewhere, trainings around risky issues tend to be prescriptive, talk down to users, and fail to meet them where they are. Proposed solutions produced by these sessions fail their users by misunderstanding them and their needs.
For example, the discussion around safety on queer dating apps typically centers on privacy and geolocation. It is often recommended that users disable this feature in order to protect themselves. This advice seems reasonable enough, doesn’t it?
However, in talking to queer communities in this study, Rigot and Shamas found that surprisingly, geolocation was one of the features that made users feel most secure when chatting with other GPS-located users on dating apps. Many respondents brought up that knowing that the person they were engaging with was someone who lived in their town made them feel safer!
This revelation underscores the importance of learning locally desired applications or service—one of the ethical guidelines for fieldwork laid out by PERCS at Elon University. It is crucial to tailor any solution that you are designing to the specific needs of your user, and to uncover those needs through dialogue and direct engagement.
The Article 19 team found that devoting energy to developing geolocation solutions would not have been the best use of their time and resources, especially as many users already employed tactics such as GPS spoofing to preserve their anonymity on queer dating apps. Instead, users expressed that they would find it beneficial to have legal resources embedded in the apps they use in the event that they found themselves a target of government surveillance or other abuse.
In their findings, the Article 19 team also identified a desire for app icon cloaking. Suspected “deviants” in the countries surveyed sometimes found their property, including the information on their phones, subject to search. A queer dating app discovered by a government official could be grounds for penal action. By cloaking their app icons, users might be able to keep themselves safe(r) by disguising, say, Grindr, as something so innocuous as a calendar or calculator app.
Perhaps this reality seems distant from a US perspective, as we live in a country where a queer person can legally adopt children, marry their beloved, and even run for president. However, the reality is that despite our tenuous legal protections, many queer Americans live in daily fear of persecution, discrimination, and violence. Solutions like the above can still be of use even to those who do not live in such overtly hostile environments. Designing solutions for the most marginalized in society will yield applications that can protect all users.
Works Referenced:
Costanza-Chock, Sasha. (2018). “Design Justice: Towards an Intersectional Feminist Framework for Design Theory and Practice.” Proceedings of the Design Research Society 2018. https://ssrn.com/abstract=3189696.
PERCS: The Program for Ethnographic Research & Community Studies. “The ethics of fieldwork.” Elon University. http://www.elon.edu/docs/e-web/org/percs/EthicsModuleforWeb.pdf.
ReyBee10. (2018, Oct 10). “#HarmReduction was started by sex workers, queer & trans PoC, people who use drugs, people in the streets saving their own lives and all the intersections thereof— not by public health folks….respect the origins and beware co-optation..to paraphrase @HarmReduction #HarmRed18” [Twitter post]. Retrieved from https://twitter.com/ReyBee10/status/1052975455748452352.
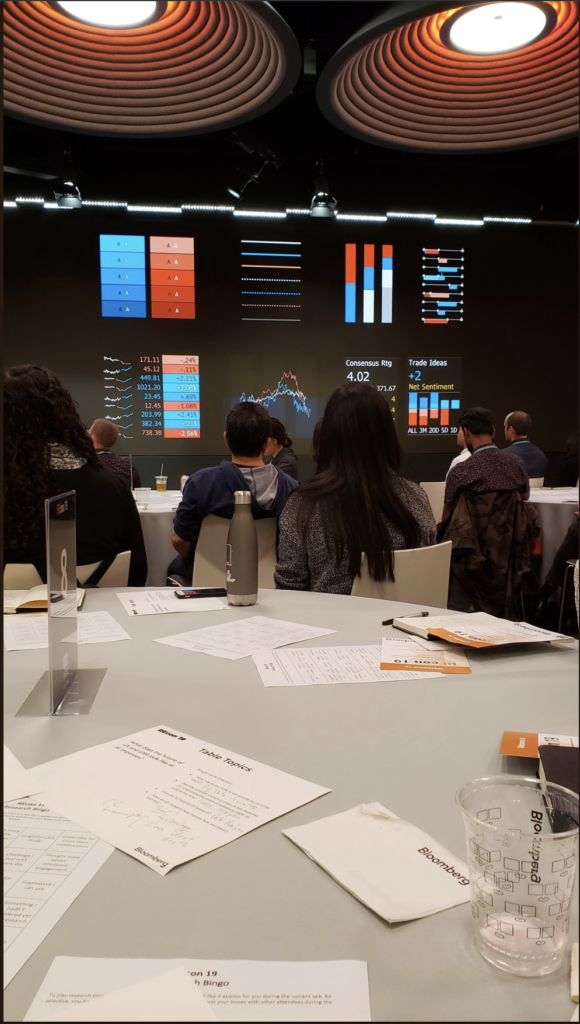
“REcon” is a yearly free conference for user researchers, and this event is an excellent opportunity to learn from industry leaders, share ideas, expand the connection, and discuss all things user research. The event was hosted on Oct. 5th and located at Bloomberg LLP. I was so excited to have this opportunity to join ‘REcon’ event. The event has all senior and above UX designers on-site to give speeches of sharing their experiences.
Audiences checked in around 8 am and had a short social time in the breakfast session. Most of the people I chatted with are from UI/UX design industry or have the intention to transfer into this industry. We exchanged our ideas about how we started to think about working as UI/UX designer. I met a guy who currently works as a UX researcher in Instagram with a very different background. He majored in gender studies when he was in college. He began to think of pursuing his career as a UX researcher when he worked on his graduate project. His topic was about porn culture and focused on human needs. He told me that when he worked on his project, he has done tons of interviews about why people watch porn. The result made him realize that the success of a product is all about meeting customers’ needs, and he found he would like to dig deeper into UX research field and design a product that matches customers’ needs. After having a small conversation with this interesting guy. The event was about to start.
The first guest speaker is Rachel Carpenter, the head of Design Strategy in Citi. She talked about why sometimes clients don’t care about the research and the result, but they still want researchers to do about it. She elaborated on what a researcher or designer should do when faces this situation. The first thing to do is to pitch the result and design ideas to the clients. During the process, give the clients multiple options to choose from, and interact with clients so that clients will have the sense of participant during the whole process. Thus, clients will have more interest in learning more about your research because they feel they are part of it. She also gave some suggestions and ideas about how to present your talent among your colleagues.
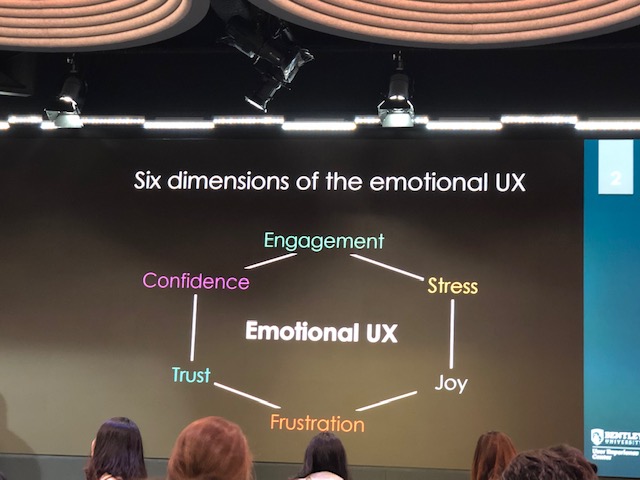
After Rachel, two more guest speakers who are from Bentley University, gave a speech about ‘A case study in measuring emotional engagement of customers using a virtual dressing room on an e-commerce website.’ They presented the research about users are most likely having the suspicious, ‘Is that really me?’ The key challenges they had were to accurately measure a potentially wide range of customer emotions, including engagement, joy, frustration, trust, surprise, and disgust. Their presentation shares the results from a case study that focused on measuring customer emotions while using different virtual dressing rooms using e-commerce websites. Biometric data from users, such as eye-tracking, facial expressions, and galvanic skin response (GSR), show a complete picture of the emotional customer experience which would otherwise be difficult to detect using analytics, market research, or traditional user research methods. This was a really interesting case study, which made me realize how widely the usability knowledge can practice in our world.
The dimensions of the emotional UX
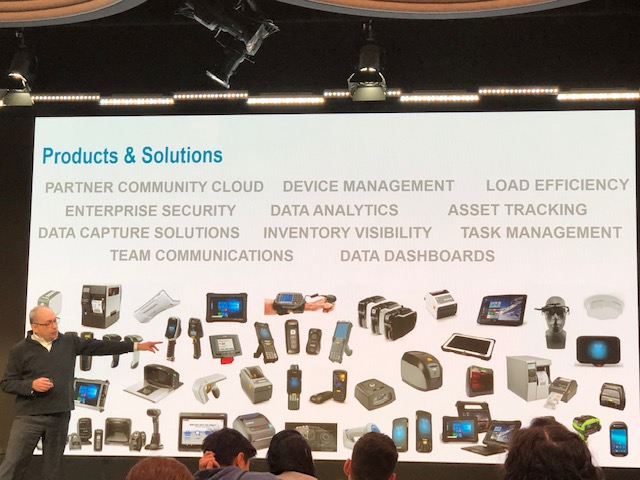
Next, we had Graham Marshall who from Zebra Technologies presents his talk about ‘Service design methodology for enterprise operations.’ He said that this methodology is often used to track the journey of a consumer through a thoughtfully designed retail environment or a citizen participating in a community service. This methodology is mainly used to analyze the dynamics of enterprise operations. At last, he stated that the practice of this methodology help to be able to communicate the interconnected complexities of the challenge and demonstrate where we might take it had been the most significant benefit of service design methodology.
Graham was talking about the how to practice his methodology in the real world
After Graham’s great speech, we had a lunch session in Bloomberg building. Staff from Bloomberg showed us around the building and the design department. Though Bloomberg is known as a finance company, the design department is more like an art corner which is full of creative decorates and structure. Bloomberg held a great lunch session, and they gave each table a topic to discuss during lunchtime to help people better interact and connect with each other. They even hand out some small games like ‘usability term bingo’ to make lunch more interesting.
In the afternoon, the first speech was presented by two Bloomberg user experience designer, Jaris Oshiro, and Hala Shih. The topic they talked about is color accessibility. They elaborated on what they would design for color vision deficiencies in the financial industry with their Bloomberg Terminal as an example. The presentation enlightens me that UI design should consider people from different groups, such as people with color vision deficiencies. Also, it reminded me of Norman’s design thinking regarding the culture constraints that ‘ Each culture has a set of allowable actions for social situation’ (Norman, 2015). If the culture is not able to be changed, then the change should be made on design. Every industry should not discriminate against those people having an abnormal part.
Hala Shih showed the color vision deficiencies design on Bloomberg terminal
The last speech was presented by Natalie Connors and Tiffany walker, who is a director of design and strategy department and senior UX researcher JP Morgan Chase. Their speech was the one that I can relate most since they gave the idea about how to do the essential work in UX research. They shared some case they have done with Cognitive Walkthrough, Heuristic Evaluation and Usability Testing, which are the three topics that I am learning in this semester. Moreover, they also shared the tricks when they are doing the research, they will research about clients’ behavior at first. For better future service, it’s essential to know more about their clients’ preference. From Natalie’s talking, I was thinking of Wilson says ‘ the origins of human information study is seeking behavior research’ (Wilson, 2000).
Natalie and Tiffany present what we should do in daily UX research work
In general, I had a great experience in this ‘REcon’ event. I met and talked to lots of interesting people. From the conversation with them, I realized I have a long way to go and feel like I have hidden passion in this industry. I believe what I have learned in this event would help me with my career in the future.
References:
Norman, Donald A. The Design of Everyday Things. MIT Press, 2013 Wilson, T. D. (2000). “Human Information behavior.” Informing science 3(2): 49-56
On October 4th, the Pratt Chapter of The American Library Association organized a tour of The Explorers Club, as well as a discussion with their Archivist and Curator of Research Collections, Lacey Flint. Headquartered at 46 East 70th Street since 1964, the Club occupies the former residence of Stephen C. Clark, an interesting figure among New York museums and history in his own right, and founder of the Baseball Hall of Fame in Cooperstown. While Clark did not have a direct affiliation with The Explorers Club, his tastes in architecture and interior design have certainly shaped its surroundings.
Welcome to the Club
As we ascended a hundred year old staircase and made our way past the mounted Polar Bear, it was clear we had entered a very unique kind of club. Seated before Ms. Flint, in a room lined by various framed expedition flags, our group was treated to a substantial information session about the history of the organization, and her professional responsibilities. Joined at times by other staff members who offered additional insights as they were going about their duties, we also had an opportunity for some Q&A with Ms. Flint following her presentation and throughout the tour.
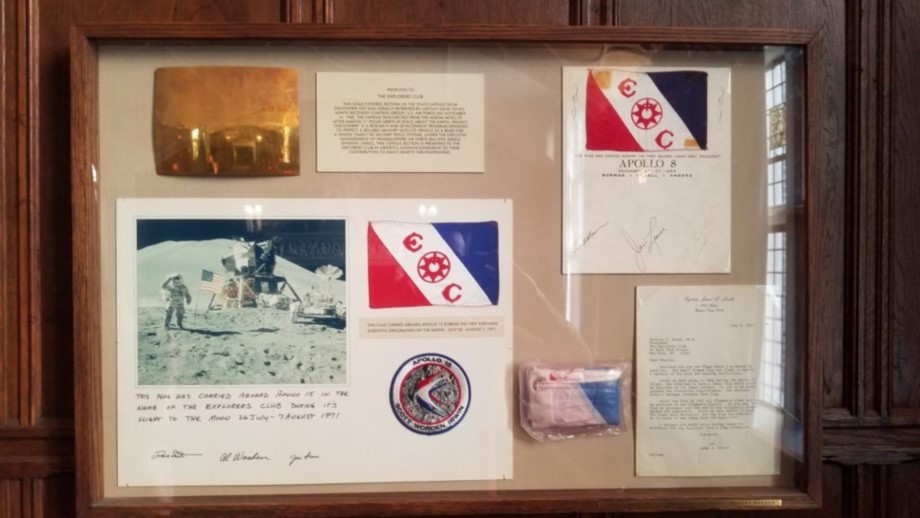
We learned that Explorers Club flags have been carried to the top of Mt. Everest, and the depths of the Marianas Trench, both the North & South Poles, as well as the surface of the Moon. Since 1918, over 200 flags have accompanied Club members on excursions all over the globe (occasionally beyond) and as I foresee myself eventually working within a museum or similar institution, one of my first questions for Ms. Flint was about the preservation of the flags and other items in her care. Despite being ensconced in the opulent trappings of Madison Avenue, the Club’s collection is curated under relatively austere means, and many of the retired and framed flags surrounding us were in need of conservation care and remounting under appropriate archival glass.
The largest lunar flag was never flown, it remains in a sealed bag from the Apollo 13 mission
Progressing into what was previously the Clark family library, we were again reminded of the Club’s constant need for generating revenue, as they were in the midst of preparing the space for a ticketed event titled Tales from Dark Places. Though the bookshelves were partially obscured by large paintings of cave scenes (and rather ominous ones at that), it was easy enough to imagine a quiet read in the shadow of the fireplace’s massive mantel. What was less easy to imagine was how the family was able to navigate the assembled volumes, as Ms. Flint revealed to us a quirk of their personal cataloging. As opposed to author, title or even year of publication, we were told the books were sorted under broad generalities such as ‘things that fly’, a description that can encompass animals, aircraft and even celestial bodies.
This intriguing classification system brought to mind Finding Augusta, particularly the idea of “similarity” and the TSP. (Cooley, 2014) Viewing the library through the lens of the traveling salesman problem, I could imagine the parallels of trying to most efficiently find your way through the seemingly haphazard collection, while trying to gauge the similarity of subject matter as understood by someone else. Just as ‘Augusta’ could simultaneously describe many disparate things to different people, so did this Clark library lend itself to unique interpretations by those using it.
Just Lion around
Reaching the highest level of The Explorers Club, our group became acquainted with the main showroom, and its large taxidermy collection. Despite the delicate nature of the artifacts, the room housing them is not climate controlled, nor have any countermeasures been implemented as of yet to address ultraviolet degradation from sunlight through the windows. (Though we were told the curtains are kept drawn most of the time) I had recently read “Fundamental Forms of Information” before the tour, and as we learned more about the mounted specimens, a passage immediately came to mind:
. . . structures previously associated with life recede back into their natural, inert forms. Trace information is that information that is degrading from being represented information (encoded or embodied) into being natural information only (neither encoded or embodied). Trace information includes the no-longer-used wasps’ nest, waste heaps, carrion, disintegrating ancient scrolls, and so on.
Bates (2006)
Trace Information?
Even under the best of conditions, (and sadly the Club is far from being able to provide that) these artifacts and the information they contain, can not survive forever. As Bates explains, all organized elements eventually break down into basic patterns of matter and energy, and while organic decay is unfortunate, the loss of life of these animals in the first place is no small tragedy in itself. Though Ms. Flint assured the group that the particular examples on display were the result of scientific research, and not sport hunting, it is never easy to clearly discern the motivation of previous generations, and even a commemorative plaque within the room described the assorted animals as “trophies”.
Thinking back on this risk of complacency with questionable past cultural norms brought to mind a recent reading selection from Robert Jensen. His examination of “neutrality” in GLAM fields points out the potential dangers in accepting the status quo of an institution’s practices. (Jensen, 2006) Looking back on the tour with this additional perspective, I find myself conflicted over The Explorers Club’s taxidermy collection. While the specimens may still possess historic significance and cultural relevance, is their continued display a tacit approval of all the killing necessary for them to exist in the first place?
These shadows of the past can loom large in the ornate corners of the old Clark home, but moral ambiguity was not the exclusive takeaway of the day. Despite some questionable collection priorities, the Club does maintain its dedication to exploring the natural world, and one item in particular struck me as an eloquent overlap of information and exploration.
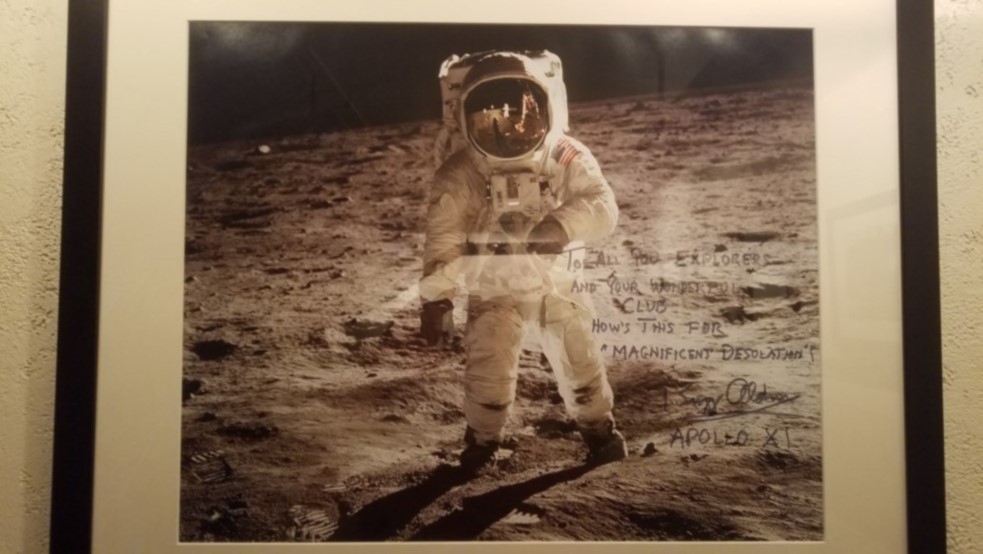
Cheese
In this image, an inadvertent “selfie” of Neil Armstrong as captured in the reflection of Buzz Aldrin’s helmet, we see one of the only photographs of the first man to ever step foot on the Moon, and it was accidental! No satellite imaging, no high definition digital recording, not even a particularly captivating pose, just a man with some film in his camera snapping a photo of his coworker. Oh, and they just happen to be 200,000+ miles removed from the face of the Earth at the time. To be on the literal frontier of science, technology and human advancement, at the edge of the Abyss, and to capture it all with the click of a simple, mechanical shutter, it is a remarkable juxtaposition.