Geovisualization: Mapping NYC’s Projected Population in 2010–2040

July 25, 2018 / 0 comments

Introduction I decided to take another look at the summary of NYC’s projected population over 2010–2040 by the Department of City Planning. This rich dataset adds categorization to population statistics by age groups and boroughs of NYC. Besides including totals, the summary sorts the population information into categories of age groups (18 age groups between the…

Read more →

NYC School Safety Report – 2010 – 2017

July 24, 2018 / 0 comments

This research started with a simple question; I wanted to understand if there was a correlation between school violence, (such as robbery, assault, etc.) plus the violence of regions around schools with the amount of extra-curricular activities that those kids have. In other words, I want to understand if kids have more stuff to do…

Read more →

Wildfire Risk Zones Throughout California

July 24, 2018 / 0 comments

Introduction Depending on rain levels each year, fire season in California has the ability to ravage certain areas, stretching from backcountry to populated areas. Wildfires are expected; they clear away dead vegetation and weak trees creating space and opportunity for new and stronger growth. At the same time, if uncontrolled, they have the potential to…

Read more →

The Price of Freedom: Gun Violence and Children

July 24, 2018 / 0 comments

Introduction “This is the price of freedom.  Violent nuts are allowed to roam free until they do damage, no matter how threatening they are.” A quote from Bill O’Reilly’s Blog, No Spin News, regarding the mass murder in Las Vegas at the Mandalay Bay hotel in the Fall of 2017.  This quote, unfortunately, clearly states that…

Read more →

Cultural and Mardi Gras Maps of New Orleans

July 24, 2018 / 0 comments

Introduction New Orleans—a city located in the Deep South nestled in a crescent bend in the Mississippi River—has a rich cultural history. Despite sub-tropical climate, and the guarantee of biblical weather, it remains a place of resiliency, love, and hope. Indeed, New Orleans is my hometown and, although a New Yorker now, I am forever…

Read more →

Mapping the New York School Crime Rates

July 24, 2018 / 0 comments

Introduction Not only the Tableau Public, Is there any other tools can analyze data by mapping? 3 Inspirations https://carto.com/gallery/internet-standards/ https://carto.com/gallery/stolen-cars/ https://carto.com/gallery/lifewatch-inbo/Process Carto is a complexed tool, which requested the designer has to have clear thoughts about putting data in order. The process of refining the data is more complicated than others. I download the data from the…

Read more →

Museums in NYC

July 23, 2018 / 0 comments

The topic of this information visualization mapping lab are the museum’s in New York City’s five boroughs in comparison with the average median household incomes for the different neighborhoods in said boroughs. I hope to analyze the relationship between these two subjects in the city. As museums in this country do not wholly depend upon…

Read more →

Bigfoot Nation: An exploration of Bigfoot legend in the American wilds

July 20, 2018 / 0 comments

“Bigfoot” is a cornerstone of North American folklore dating back 400 years to Native American myth. This creature is described as a 6- to 9-foot bipedal man-beast, sometimes completely covered in black, brown, or burnt red hair and always described as having very large feet. Despite claims by the scientific community that Bigfoot is nothing…

Read more →

Avatar: The Last Airbender Social Network (Season 1)

July 19, 2018 / 0 comments

Inspired by the Les Miserables network example that Gephi provides, I decided to take a look at the social network of a TV show I was more familiar with, the Nickelodeon cartoon Avatar: The Last Airbender. While I initially wanted to take a look at the overall show, I ended up focusing just on the…

Read more →

Zachary’s Karate Club

July 19, 2018 / 0 comments

Zachary’s Karate Club is a well-known dataset that describes the relationships in a university karate club, used by Wayne W. Zachary in his paper “An Information Flow Model for Conflict and Fission in Small Groups.” This dataset is famous for its clear depiction of community structure, which occurs when nodes of a network can be…

Read more →

Network Map: Top 1000 Frequent Occurring Surnames Between Races

July 18, 2018 / 0 comments

Introduction I was able to interpret data provided by studying information from the 2010 Census. The data presents a normalized list of the top 1000 shared surnames between six, general and world race groups as defined by the US census. By creating a network visualization the intention is to determine the strengths between races and…

Read more →

NCAA FOOTBALL – Matchmaking Network

July 17, 2018 / 0 comments

NCAA FOOTBALL – Matchmaking Network   This research over network data started really fuzzy. It was hard to find data and information about a topic that was relevant to me, and at the same time easy to understand. The data selected was a study of the NCAA Football league, where I connected all the teams…

Read more →

Marvel Characters by Adam Kubert

July 17, 2018 / 0 comments

Introduction Using the Marvel Database API, I pulled data on all the different Marvel characters featured in issues by artist Adam Kubert to create a visualization in Gephi. Inspiration Looking at the example of connections amongst jazz musicians, I wanted to use the Marvel Database to create a similar chart of creatives. Each book, much like…

Read more →

San Francisco in Cinema: A network of SF film locations

July 17, 2018 / 0 comments

I selected data on film locations in San Francisco to inform my data visualization in Gephi. I’m not a movie buff but I do know San Francisco well and was interested in seeing what locations were memorialized in film. For reference, we explored the visualizations from Gephi directly and other sites. The two that stood…

Read more →

Ego Network of British Suffragette Emmeline Pankhurst

July 17, 2018 / 0 comments

Introduction My Gephi visualization is based on relational data on the British suffrage movement and, in particular, focuses on the network of suffragette Emmeline Pankhurst (née Goulden, 1858-1928). Born to activist parents, Pankhurst used political agitation and militancy to advance the vote to all women in the UK. Her home (an interesting parallel to contemporary,…

Read more →

PEOPLE REPORTING ANCESTRY – US Native American Indian

July 17, 2018 / 0 comments

Written by Jamie Raymond Information Visualization Summer Course at Pratt Institute This data set analyzes ancestry of all American Indian Areas/Alaska Native Areas/Hawaiian Home Lands within the United States in 2016 census found on United States census Fact Finder website, https://factfinder.census.gov/ using the following filter options: The Data was optimized for Gephi by cleaning in…

Read more →

Dogs in New York City

July 17, 2018 / 0 comments

View the dashboard on Tableau I’m New Yorker who always gets excited when I see a dog on the street, but I can’t have one myself. When I found New York City’s dataset on issued dog licenses I thought it would be fun to take a look at where all the dogs in the city…

Read more →

Game of Thrones – Co-occurrence Network of Characters

July 16, 2018 / 0 comments

Game of Thrones Network The topic of this information visualization network lab is the co-occurrence network of characters in A Song of Ice and Fire, or the five books in Game of Thrones that fall under that series. This book and HBO series has become a world-wide phenomenon over the past decade. I was interested…

Read more →

The 62 Dolphin’s Network Visualization

July 15, 2018 / 0 comments

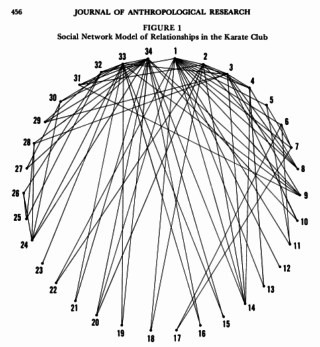
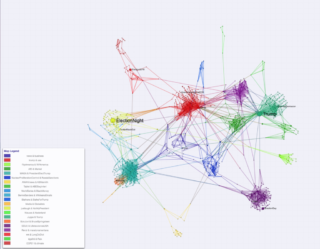
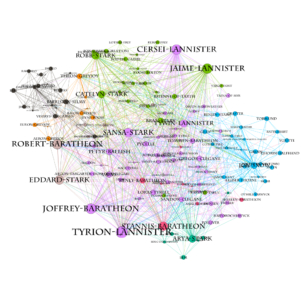
Introduction “Networks are not the same thing as “networking,” or actively using a network to make connections to further one’s personal goals. A network is simply a set of rela­tions between objects which could be people, organizations, nations, items found in a Google search, brain cells, or electrical transformers. Transformers do not “network.”In this book we…

Read more →

Summary of NYC Projected Population over 2010–2040

July 11, 2018 / 0 comments

Introduction In keeping with getting to know more about my surroundings, I decided to investigate any significance in the population of NYC. In particular, in particular, this study became a way to discover patterns in the population summary by plotting it over time. NYC OpenData gave way to more particular information that is a summary…

Read more →