A Timeline of the History of GIS

September 12, 2018 / 0 comments

Introduction GIS, short for geographic information systems, is a system that was designed to better understand geographic data. With the help of GIS applications, users are aided in analyzing spatial information, creating searches for data, and interpenetrating maps with slightly more ease. While it would seem obvious that a lot of the emergence of this…

Read more →

A History of Chords Diagrams

September 12, 2018 / 0 comments

    Introduction: Chord diagram is a relatively new form of information visualizations. It is a type of diagram that visualizes the inter-relationships between entities. The connections between entities are used to display that they share something in common. This makes Chord Diagrams ideal for comparing the similarities within a dataset or between different groups…

Read more →

History of Thematic Mapping: A Timeline

September 12, 2018 / 0 comments

History of Thematic Mapping: A Timeline   Introduction For this lab report I chose to focus on study the milestones in the history of Thematic Mapping. I was particular interested in this part of information visualization because the understanding of “location intelligence and its applications” across the public has grown a lot, and thematic maps…

Read more →

History of Infographics – An Interactive Timeline Of Most Iconic Infographics From 1630 to 1693

September 12, 2018 / 0 comments

  Introduction We live in an age of data visualization where the Internet has been flooded with graphics containing useful information, be it the literacy rate of different countries or websites showcasing the change in the climate. Every single useful information on the web is being converted into images and graphics. But this isn’t the…

Read more →

History of Photography

September 11, 2018 / 0 comments

Introduction Photography is an art of creating images. I have always wondered how photography was molded to its current digital age. People today have smartphones to take quick pictures of anything and everything. This never existed back in the 18th century and it’s amazing how photography evolved over time: from first ever cameras and images…

Read more →

History of Scatterplots: A Timeline

September 11, 2018 / 0 comments

Introduction For this lab report I chose to focus on the important historical events related to the creation of the modern day scatterplot. I was interested in this data visualization specifically, because it is one that I encounter frequently in my academic career. Most of the research studies that employ statistics often use scatterplots to…

Read more →

Understanding who we are: milestones in demographic data throughout history

September 11, 2018 / 0 comments

[Figure 1: Title slide of Timeline JS project] Introduction Demography, or the study of quantitative data about characteristics of human populations, has been a field of study since ancient, pre-Roman times. The analysis of population data can tell us a great deal about changes like migration patterns, overpopulation risks, fertility rates, and more. This data…

Read more →

A Somewhat Brief History of Open-Source Software

September 11, 2018 / 0 comments

Open-source software has become a counter to corporate forces that institute consumer-negative practices (such as Apple’s walled garden) in an effort to raise profits for shareholders. As open-source software, tools, and other technologies rise in popularity and ease of use, it’s important to understand how open-source arrived at it’s current place, and why. This timeline,…

Read more →

A Brief History of NYC’s Open Data Law

September 9, 2018 / 0 comments

As the United States collectively wades through a very unstable political era, access to data that helps inform constituents and increase civic engagement in communities is more important than ever. Using an open source JS Timeline from Knight Lab at Northwestern University, I’ve provided a brief history of NYC’s Open Data Law and the city’s…

Read more →

Protected: Technological Innovation in the Field of Data Visualization from 1923-1980

September 8, 2018 / 0 comments

This content is password protected. To view it please enter your password below: Password: The post Protected: Technological Innovation in the Field of Data Visualization from 1923-1980 appeared first on Information Visualization.

Sampling of the Met Collection’s Watercolors

August 6, 2018 / 0 comments

Watercolors at the Metropolitan Museum of Art This final visualization presents the watercolors that are held at the Metropolitan Museum of Art. While the Met’s open dataset contains 467,665 items, the disarray of the records made it impossible to capture this breadth of information in such a condensed amount of time. I had originally hoped…

Read more →

Impact of Landmarks Designations on Surrounding Areas in Brooklyn

August 3, 2018 / 0 comments

Introduction The demolition of one of New York City’s most iconic structures, Penn Station, led to the Landmarks Law and the creation of the NYC Landmarks Preservation Commission (LPC). Created in 1965, the LPC is charged with protecting historic and culturally significant sites throughout the five boroughs.  This is done by identifying landmarks and historic districts…

Read more →

Rollercoasters around the world

August 2, 2018 / 0 comments

Summer is rollercoaster season. My friends and I have made a tradition of visiting theme parks every summer, so when I found a massive database of rollercoasters around the world at RCDB.com, I knew this was something I would be interested in doing and a topic where I knew I would be able to find…

Read more →

Gender at MoMA

August 2, 2018 / 0 comments

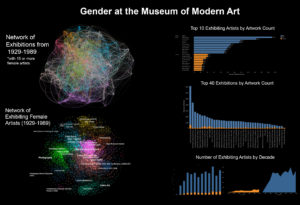
Introduction In building on my earlier Tableau project, and drawing on my work in Gephi, I decided to delve deeper into the MoMA dataset and concentrate on gender representations in exhibitions held between 1929-1989. The Museum opened in 1929 and its first exhibition—Cézanne, Gauguin, Seurat, van Gogh—occurred in November of that year. According to the…

Read more →

Film Tax Credit — Productions

August 1, 2018 / 0 comments

NYS Governor’s Office for Motion Picture & Television Development offers a Film Production Tax Credit for 30% of qualified costs for eligible New York State productions and an extra 10% credit labor costs incurred in Upstate New York. In order to qualify for the tax credit, productions must fit the criteria set by New York…

Read more →

Visualizations and Geovisualizations: Population Summary of NYC

August 1, 2018 / 0 comments

Introduction Previously, I examined the population projection over the years of 2010 through 2040 (Time-Series Visualization: NYC Projected Population over 2010–2040). While those visualizations display a summary of the projected population for the years over 2010–2040, I wanted to seek and attempt to determine more relationships in NYC’s existing population summaries. The dataset is from American FactFinder/US…

Read more →

Mapping the Brazilian Crime Scene & its Causes

August 1, 2018 / 0 comments

Inspired by my latest research, where I’ve contrasted the youth crime rate of some regions of New York City with the number of extracurricular activities that kids have in those areas, I decided to bring this question to my hometown: Brazil. It’s not news that the Brazilian crime rate is tremendous, and compared to NYC,…

Read more →

Targeting the Safest Area to Invest A Condo in Manhattan

August 1, 2018 / 0 comments

Introduction In the contemporary age, websites and apps are the essential tools for everyone to communicate, to spread ideas, and develop businesses. Before design, a website or an app, analyze data is necessary for making decisions. StreetEasy is a functional app for New Yorkers to find a forever home or rent a home. When people trying to…

Read more →

Gender Portrayal in Film

July 30, 2018 / 0 comments

The Bechdel test is a ruleset used to measure the representation of female characters in a work of fiction. A work passes the test under the conditions that 1) two female characters [with names] 2) hold a conversation with each other 3) about anything other than a man. Variations on the test do exist, sometimes…

Read more →

Street Trees Per Capita by UHF in New York

July 26, 2018 / 0 comments

While browsing New York City Open Data, I saw a couple of data sets that looked like they would be interesting to compare: the results of the city’s tree census and it’s recent air quality reports. The comparison probably wouldn’t create any real results, but I thought it might be an interesting comparison to make….

Read more →