NCAA FOOTBALL – Matchmaking Network
July 17, 2018 - All
NCAA FOOTBALL – Matchmaking Network
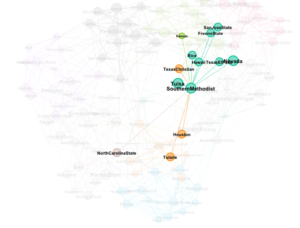
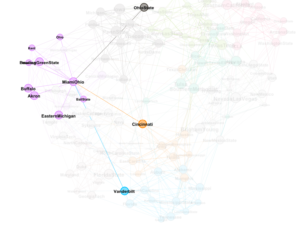
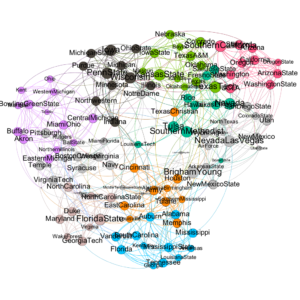
This research over network data started really fuzzy. It was hard to find data and information about a topic that was relevant to me, and at the same time easy to understand. The data selected was a study of the NCAA Football league, where I connected all the teams of the first division in a way to distinguish which team plays with who and why the most potent teams are prevalent on the top. The data itself was tough to find; I had to make the connections by analyzing a lot of sources and trying to understand the divisions in each conference.
The tools used in this visualization varied from Gephi and Tableau, I also had to manually alternate some of the spreadsheets so It will fit the needs of my visualization. The goal of this project was to understand how stronger conferences and ranks are formed, and also be used as a probability check if you are a Football fan. The results can be used in a variety of ways, such as highlighting the team you desire to see all the games and the winning percentages ( the more significant the circle, the more victory the team has). The viewer can also analyze how the Conferences are formed and the matchmaking between them.
The future directions for this project can be the implementation of the winning rate against each team, with that action, the user can highlight a match and see who has the better chance of winning. This visualization can help football fans in a variety of ways from football fantasy or betting on games.

The post NCAA FOOTBALL – Matchmaking Network appeared first on Information Visualization.