Most Popular Movies 2006-2016

October 12, 2018 / 0 comments

  Introduction: From the year 2006 to 2016, what genre of movie was the most popular? which director made the best box office performances? what kind of films were highest rated by movie buffs and critics?  Based on the dataset of 1000 highest ranked movies on IMDB, I’ve created a brief dashboard that is able…

Read more →

Job Industry As Per The Empire State Development Regions of NY From 2012 to 2017

October 12, 2018 / 0 comments

Introduction The Great Recession without a doubt affected the country’s economy, but the state of New York certainly did snap back. It is being said that the state is undergoing its largest and longest job expansion since World War II and New York City has been the driving force behind the employment growth in this…

Read more →

Data Analysis and Visualization of Museums and Related Organizations in the U.S.

October 10, 2018 / 0 comments

By Amanda Chen Introduction As a student of Museums and Digital Culture in Pratt, I always focus on analyzing data from museums and related institutions in the U.S. even around the world. Museum undertaking the social responsibilities of educating the public, serving for the community, as well as contributing to the economy. In the record…

Read more →

The Fall Of Giants – Batting of the 2018 Giants

October 10, 2018 / 0 comments

In baseball, the goal is to be the best, as it is with most sports.  However very few teams ever make it to the World Series, or even the Post Season.  So it is impressive that a team could win 3 World Series in the course of just 5 years.  However other than one post…

Read more →

2016-2017 NYC Park Felony Data by Borough

October 10, 2018 / 0 comments

Introduction My project focused on data of reported felonies that occurred in NYC parks from 2016-2017. I began this project with an exploratory approach and as I became more familiar with the data I noticed that some boroughs (Manhattan and Brooklyn specifically) were increasing in number of reported felonies committed in parks from 2016 to…

Read more →

Projected Population Increase of California (2019-2050)

October 10, 2018 / 0 comments

Introduction Data can be a list of overwhelming amount of columns and rows of informations. Tableau Public is a program that allows quick synthesis and digestion of massive amount of data by translating the numbers and information into visuals and colors. Having grown up in Southern California under homeowner parents, I’ve consistently heard about rising…

Read more →

Majority Party Shifts in the U.S. Congress: How Historical Fear Inducing Events Alter the Political Landscape

October 10, 2018 / 0 comments

INTRODUCTION: Today’s political landscape has been characterized as a culture of fear.  It has been invoked in concrete and abstract ways and channeled by politicians as they spread their messages to the electorate.  But fear has ebbed and flowed throughout American political history, and by no means is unique to this country or a political…

Read more →

NYC Leading Cause of Death

October 9, 2018 / 0 comments

Introduction Health is a very important factor to people’s lives regardless where you live. The causes can be very broad, and NYC is not an exception when it comes to people trying to live a healthy life. Living in NYC is very hectic because of the busy environment. We hear a lot of ambulances everywhere…

Read more →

Who are making phone calls to 311 NYC?

October 9, 2018 / 0 comments

Introduction (what is this post about?) NYC 311 provide the public with quick, easy access to all New York City government services and information.On one hand, NYC 311 helps Agencies improve service delivery, on the other hand, they also provide insight to improve City government through analysis and accurate measurement. This post is one analysis…

Read more →

Distracted Drivers in NYC: Looking at Cyclist Injuries Due to Vehicle Collision from October 2017 – October 2018

October 9, 2018 / 0 comments

Introduction As a cyclist who’s relatively new to New York, I’ve been wondering how often bicycle accidents from cars occur in the city, especially after watching a cyclist get hit by a car in front of my apartment last week (don’t worry – they ended up being fine). I decided to look at the rate…

Read more →

Trends in Chemical Dependency Admissions in New York State from 2007-2017

October 8, 2018 / 0 comments

By Seth Crider Data set from:    NYS Office of Alcoholism and Substance Abuse Services (OASAS)  INTRODUCTION: Finding steady ground for data-vis interests in public health was definitely a filter down process for me. Although my first attempts  at locating data sheets which explored public health was ultimately futile in in the early stages, it propelled…

Read more →

Eat out – at your own risk?: Analyzing NYC restaurant health inspection results using Tableau Public

October 8, 2018 / 0 comments

INTRODUCTION With approximately 20.5K restaurants in five boroughs, New Yorkers have a plethora of culinary choices to face on a day to day basis. Navigating this enormous number of options is difficult – especially when food safety practices may be all over the board. In an attempt to help customers quickly assess food safety, in…

Read more →

NYC is warming, but not in the ways you think

October 7, 2018 / 0 comments

Introduction The scientific consensus is that the world is getting hotter. As a resident of a coastal city (and a resident of Earth), this concerns me greatly. While scientists tell us that the planet is warming, I wanted to explore the data itself for New York City. This lead me to climate data for NYC,…

Read more →

Visualizing NYC Transit: A History of NYC Subway Maps

September 14, 2018 / 0 comments

Introduction Opened in 1904, the New York City subway is one of the world’s oldest and most complex transit systems. Designers and cartographers have publicly fought over how best to present the tangled network of underground and elevated lines (see The Great Subway Map War of 1978). Throughout the century, the subway map underwent various…

Read more →

Noteworthy Infographic Inventions from the 19th Century

September 14, 2018 / 0 comments

Introduction Infographics, a term created by clipping and compounding the words ‘Information’ and ‘Graphics’, are visual or graphic representations of information which allow clear and swift communication. They leverage human beings’ visual system’s ability to identify patterns and trends. Creating infographics is not a new technique in any way, as the earliest storytellers were the…

Read more →

Disease mapping: a historical perspective

September 14, 2018 / 0 comments

Timeline link: https://goo.gl/TBDJuy Introduction Maps, the subsection of visualization types, are powerful and intuitive for people to look at spatial patterns and geographic data. There are many variations on map types and each variation has its own strengths. For this project, I would like to see how maps could help to communicate the information of the geographical…

Read more →

History of Python Programming Language

September 14, 2018 / 0 comments

INTRODUCTION: Python is a programming language that has continually increased in popularity and use since its conception in the late 1980s.  It puts emphasis on code readability, and its syntax allows programmers to express concepts in fewer lines of code than other languages that were available at the time.  Its large and comprehensive standard library,…

Read more →

History of Weather Map

September 14, 2018 / 0 comments

Introduction Checking the weather forecast has become engrained our daily routine. We have become accustomed to accurate predictions of what temperature and weather to expect each day. The ability to know what the weather has not always been an easy access information. To know and be able to predict the weather has come a long…

Read more →

Henry Laurence Gantt and His Gantt Chart

September 12, 2018 / 0 comments

Introduction I learnt Gantt Chart for a couple of times. First from Economic and Management class, then from Engineering management class. Gantt Chart plays a crucial part in efficiency, based on a combination of clear classification and evolving progress display. Moreover, Gantt Chart comes first when it comes to visualization. This leads to this short…

Read more →

Timeline of User Interface History

September 12, 2018 / 0 comments

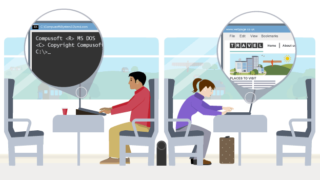
Image credit for Skystar Digital Introduction: Since the invention of computer, there is a long history of interaction experience between human beings and computers. In order to make the human-computer interaction process more direct, simple, accurate, smooth, enjoyable, we have invented entirely different types of user interface. From the rudimentary non-interactive batch interface to the…

Read more →