Water Quality, Cost & Consumption in NYC

July 10, 2018 / 0 comments

Water quality, cost & consumption in NYC,   After looking for meaningful data regarding the city of New York, I found a lot of research based on the water consumption, usage, price, and complaints regarding the city. My first approach contrasting this useful information and see what I learned from them. The inspiration behind this research…

Read more →

World Literacy Rates 2015

July 10, 2018 / 0 comments

The topic of this information visualization statistical lab was world literacy. Having taught grammar and reading comprehension in Spain for years, I know that these skills are essential for children to develop when they are young. I was curious to discover the literacy rates across different countries throughout the world, as literacy typically correlates with…

Read more →

Brooklyn: Where the Restaurants Are

July 10, 2018 / 0 comments

Introduction Changing demographics due to the rising populations in Brooklyn have had an impact on businesses, in particular, restaurants. The type and number of restaurants in an area can be a good indicator of lifestyle and income of its residents.  After recently moving back to Brooklyn, I have noticed an increase and change of cuisine…

Read more →

Census Data: California Counties

July 10, 2018 / 0 comments

Introduction I was introduced to programs OpenRefine and Tableau for the first time this month. OpenRefine allows data to be cleaned up, organized and normalized with features like selecting all related cells or transposing data to be reformatted. Tableau allowed me to take clean data and create visualizations for it through various graphs and charts….

Read more →

UNdata – National Feature Films Produced

July 10, 2018 / 0 comments

Written by Jamie Raymond Information Visualization Summer Course at Pratt Institute In exploration of the public data sets of UNdata, users from around the globe can search by “pooling” the major UN databases, which are browsable by category or keyword search. UNESCO Institute for Statistics, Data for the Sustainable Development, revealed a data set demonstrating…

Read more →

Gender and Nationality at the Museum of Modern Art

July 10, 2018 / 0 comments

The Museum of Modern Art (MoMA) is one of the largest collectors of Modern and Contemporary Art in the world. They have over 200,000 artworks in their collection. The Museum has been collecting since the height of post-Impressionism in the 1920’s, through Modernism in the 1960’s, and into the Contemporary present. As an open source…

Read more →

Visualizing the 2018 April Approved-build projects

July 9, 2018 / 0 comments

“The higher the quality of the data, the greater the potential for revelation.” — Stephen Few Introduction (Figure 1.1) Throughout the last week, I explored two software. One is OpenRefine, another is Tableau Public. According to Stephen Few, the Figure 1.1, I think OpenRefine will do the job of making the “Exploration Sense-Making – Communication”,…

Read more →

Quest for the Strongest Pokemon!

July 9, 2018 / 0 comments

Pokemon is a Japanese media franchise that features monster-characters known as “Pokemon” (pocket monsters) who battle each other for sport. The franchise includes cartoons, movies, card games, and an array of video games for multiple platforms, most famously Nintendo’s Gameboy. In these Gameboy games, players take on the role of “Pokemon Trainer” and adventure through…

Read more →

Brazilian Political History.

July 5, 2018 / 0 comments

By thinking about data in a timeline format, the first insight that stuck with me was history itself. We spent a lot of years studying history and the events that changed our society throughout the years, and by analyzing it from a linear perspective, we can have a better understanding of events and movements that…

Read more →

Mapping: Visualizing the World Around Us

July 3, 2018 / 0 comments

Introduction Viewing a map can feel like an invitation to share a path and an experience. As information visuals, they are rich in storytelling. Maps can be inspiring, insightful or manipulative. They can capture not only practical knowledge but can provide historical, social, economic or political information. All maps are an effort to visualize the world…

Read more →

The California Gold Rush: 1848 – 1855

July 3, 2018 / 0 comments

Introduction: Choosing A Topic Learning about formatting a timeline, I selected a topic quickly the first class to start exploring the features and by the second cIass realized I’d like select a topic a little more relevant to myself and/or places I’ve lived. I lived in Oakland for many years and decided to make a…

Read more →

Maps of Florida

July 3, 2018 / 0 comments

One of the earliest maps of Florida. Florida has a signature silhouette that most Americans can identify in a single glance, but it turns out that this hasn’t always been the case. Mapping a large peninsula like Florida required a massive human effort, both technologically and politically, and it’s only recently that we’ve come to…

Read more →

Information Visualization & History of Open Data

July 3, 2018 / 0 comments

Written by Jamie Raymond Information Visualization Summer Course at Pratt Institute In an era when data drives key decisions, there is importance to present the data and for the visual to tell the audience a story and visual representations can enhance learning and understanding. The Interactive Design Foundation describes Information Visualization as “the process of…

Read more →

Look at the Time

July 3, 2018 / 0 comments

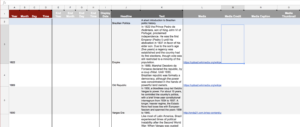
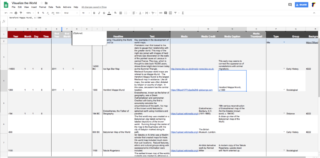
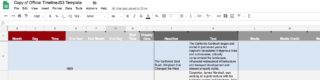
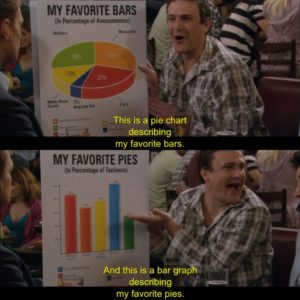
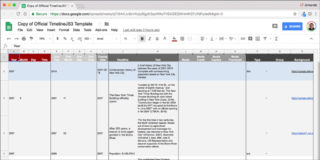
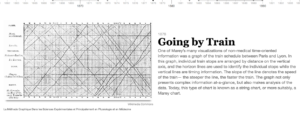
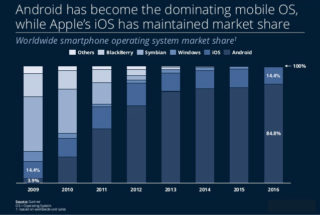
View the timeline: Look at the Time: Different methods of marking time through data visualizations I started with a goofy idea, a timeline of timelines, in the vein of Marshall Eriksen: Marshall’s visualizations are pretty specious, but I think I was able to successfully compile a handful of information visualization milestones that illustrate ways we…

Read more →

The Evolution of the Coca-Cola Bottles

July 2, 2018 / 0 comments

Introduction Serval days ago, I bought an unopened, vintage Coca-Cola, the owner of that vintage store, could not tell me when was that Coca-Cola being produced. I always thinking about to figure that out myself, and when I saw the TimeLine JS project, I thought about this right away. During the research of this project,…

Read more →

History of Madrid timeline (600-present)

July 2, 2018 / 0 comments

Lab Report 1: History of Madrid The topic of this information visualization JS timeline lab is an abbreviated history of the city of Madrid, Spain. I wanted to know how I would highlight the history of such an old city in under 20 pages on the JS timeline. It was a personal synthesis of my…

Read more →

A Timeline of New York City’s Contemporary History from 2007 to 2017

July 2, 2018 / 0 comments

Introduction to Timelines Creating a timeline involves listing a series of events from beginning to end. Given the desire to learn more about my new home, I became interested in representing significant events in the recent, contemporary history of NYC. As a new resident to New York City, it’s important for me to find and establish…

Read more →

Chronophotography and the Power of Movement

July 1, 2018 / 0 comments

Introduction My Knight Lab Timeline was inspired by Eadweard Muybridge’s ‘small multiples’ and Étienne-Jules Marey’s Paris-Lyon train schedule and Chronophotographic Gun. These related visualization milestones appear on “An Interactive Timeline of the Most Iconic Infographics” (www.infowetrust.com/scroll/). Muybridge (1830-1904) and Marey (1830-1904) were contemporaries and contributed substantially to the field of photography through their technological inventions….

Read more →

Mobile Operating System Transformation in a Digital Decade

May 13, 2018 / 0 comments

Introduction Smartphone and app seems to dominate people’s daily lives. Since I have some design experiences about electronic devices, I am very curious about the digital world of smartphone development in the recent decade. At the same time, social media, which change the way individuals and large organizations’ communicate, also made huge impact recent years….

Read more →

Populated Places in the World with Carto

May 11, 2018 / 0 comments

Introduction Populated place, known for the places of human settlement, is a geographical area constituting a city or town. In geography, statistics and archaeology, a settlement, locality or populated place is a community in which people live. A settlement can range in size from a small number of dwellings grouped together to the largest of…

Read more →