Bigfoot Nation: An exploration of Bigfoot legend in the American wilds
July 20, 2018 - All
“Bigfoot” is a cornerstone of North American folklore dating back 400 years to Native American myth. This creature is described as a 6- to 9-foot bipedal man-beast, sometimes completely covered in black, brown, or burnt red hair and always described as having very large feet. Despite claims by the scientific community that Bigfoot is nothing more than myth, several organizations are fully dedicated to the discovery of this creature. In 2017, one such organization (comprised of three generations of Sasquatch hunters lead by T.J. Biscardi, AKA “The Godfather of Bigfoot”) offered a $1M bounty to any tip that could lead to the capture of a live Bigfoot. This bounty set off a flurry of interest in Bigfoot data—specifically, the freely available reports hosted by the Bigfoot Field Researchers Organization (BFRO) on their website which contains 92 years of geocoded Bigfoot sightings. The hope by some researchers was to identify the most likely location to find a Bigfoot and win a million dollars. (Or at least have an interesting topic of conversation at their next party.)
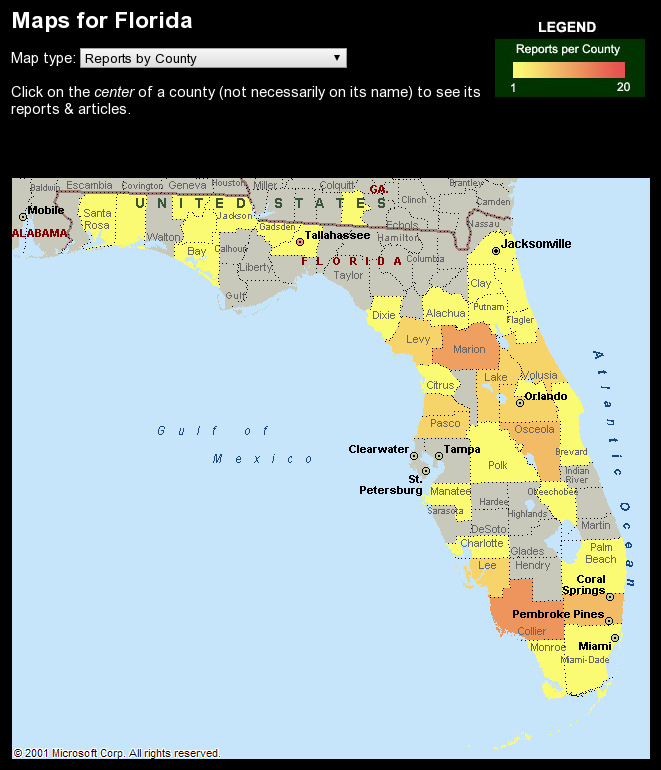
The BFRO website is host to over 3,000 verified Bigfoot sighting reports. Reports are extremely detailed, including not only a full description of the location and event but also weather information such as visibility, cloud cover, wind shear, moonphase and more. These reports are submitted by witnesses (or on behalf of witnesses) and fact-checked by a force of volunteer investigators that classify each report on a scale of A to C, with Class A representing the most-likely, verified, first-hand, close-proximity accounts and Class C representing likely hoax or unverified reports. The BFRO website allows visitors to explore the reports through a series of color coded maps, such as this map of Florida (which is home to the second most frequent sightings of Bigfoot, behind Washington.)

The BFRO maps work on a state-level with areas divided into county, and they have several different views that allow the investigator to see the number of reports by county, the number of reports by density, and the location of reports in relationship to terrain and highways. However, my favorite part of this map isn’t the map itself but the related table that links to individual reports, such as one highly detailed 2008 report near where I grew up that sounds like a campfire story in my own backyard.
The BFRO reports can be viewed through the website but the dataset itself is difficult to use for purposes of winning a million dollars. One motivated researcher, Timothy Renner, wrote a script to download the database as a csv, posted a cleaned dataset to data.world, and used it for his own hunt for Bigfoot. Renner placed all the reports onto a map of the US and clustered the points to identify the most active Bigfoot regions.
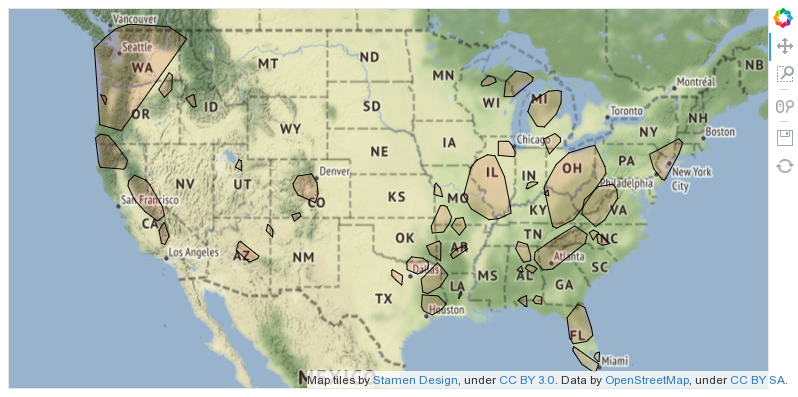
This map isn’t very interactive, but it does show that by Renner’s observation, the most Bigfoot sightings are located in forested areas. (Renner chose not to adventure into the woods to find Bigfoot on his own because he has “a family and a job and stuff.” So much for a million dollars!)
Renner’s map isn’t the only significant study to come out of the BFRO’s reports. Joshua Stevens created his own map of Bigfoot sightings in relationship to US Census data.
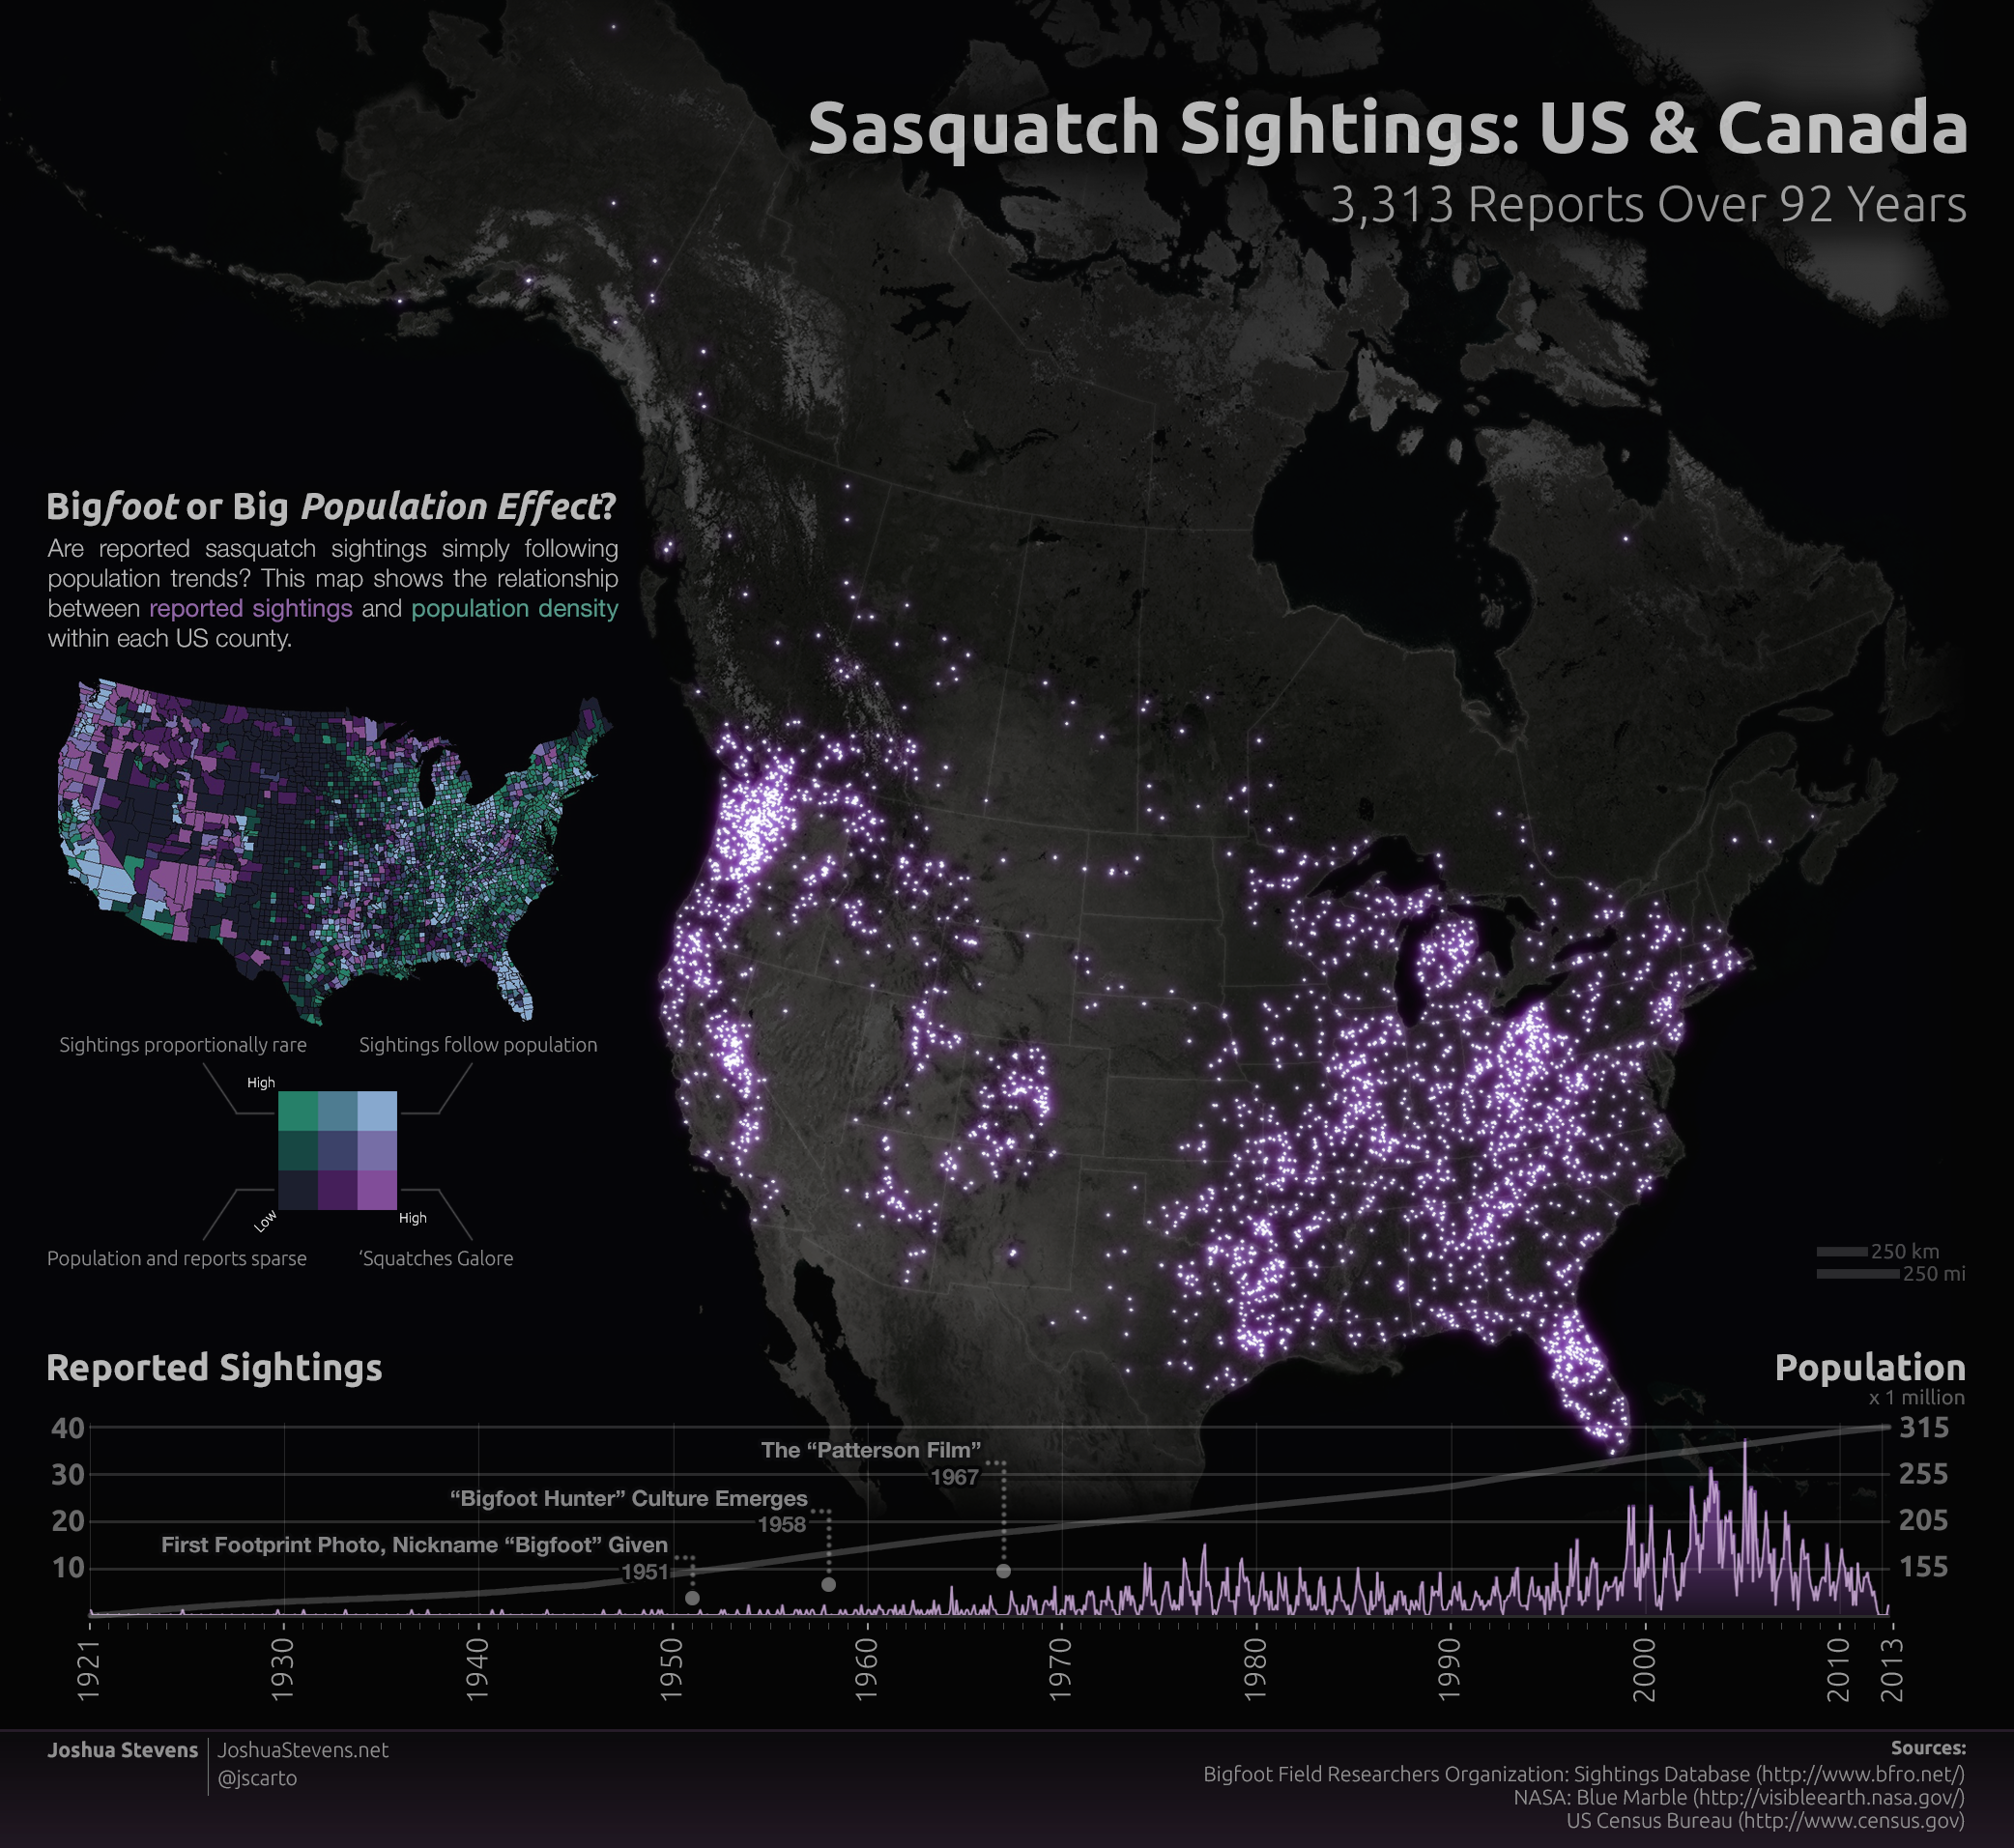
This visualization is by far my favorite that I’ve found. Not only is it visually appealing, it demonstrates a complete concept in a single image: it addresses the question of whether Bigfoot sightings are related to population density. Bigfoot sightings adjusted for population (seen on the left) shows that some areas exist where a Bigfoot sighting is unusually common and other areas where sightings are unusually rare. Of course, this doesn’t mean that Bigfoot is real and lurking in the woods of Washington. The population data is from the US census, which tracks where people live but does not gauge where people spend most of their time on vacation, hiking, or camping. Also take into account that the locations in BFRO reports ren’t likely exact (dropping a pin on Google Maps isn’t high on the list of priorities when faced with Bigfoot) and it becomes clear that mapping Bigfoot sightings to local population is probably a bit dicey.
All of this taken together, I set about creating my own Bigfoot Nation map using the BFRO dataset made available by Renner. Being excited by the Bigfoot legend myself, my first attempt at using the dataset was to determine which national park I should go to if I wanted to maximize the chance of seeing Bigfoot first-hand. I loaded the reports into Carto along with shapefiles for US national parks, but it turned out not to be exciting. So many reports exist outside of national parks that the parks were overwhelmed. This made me curious about how the BFRO reports are related to terrain, so I next investigated US forests, which seemed to be correlated to some clusters of sightings but entirely ignored Florida, which houses the second largest number of sightings and is mostly swamp area, not forest. That’s when I discovered the Landscape Conservation Cooperative Network (LCC), which divides up regions of North America by terrain. And voila, a picture started to form.
When I saw the shape of Bigfoot sightings lined up by terrain, I started to get a feeling for what Bigfoot might be like. I could envision a wilderness creature lurking in the woods or swamp or even on a remote mountain pathway, limited by the boundaries of nature rather than state or county lines. I colored the regions by the density of reports by region size and selected an underlying map that shows what the terrain looks like so I could see the landscape Bigfoot likes best. I discovered the Bigfoot wilds.
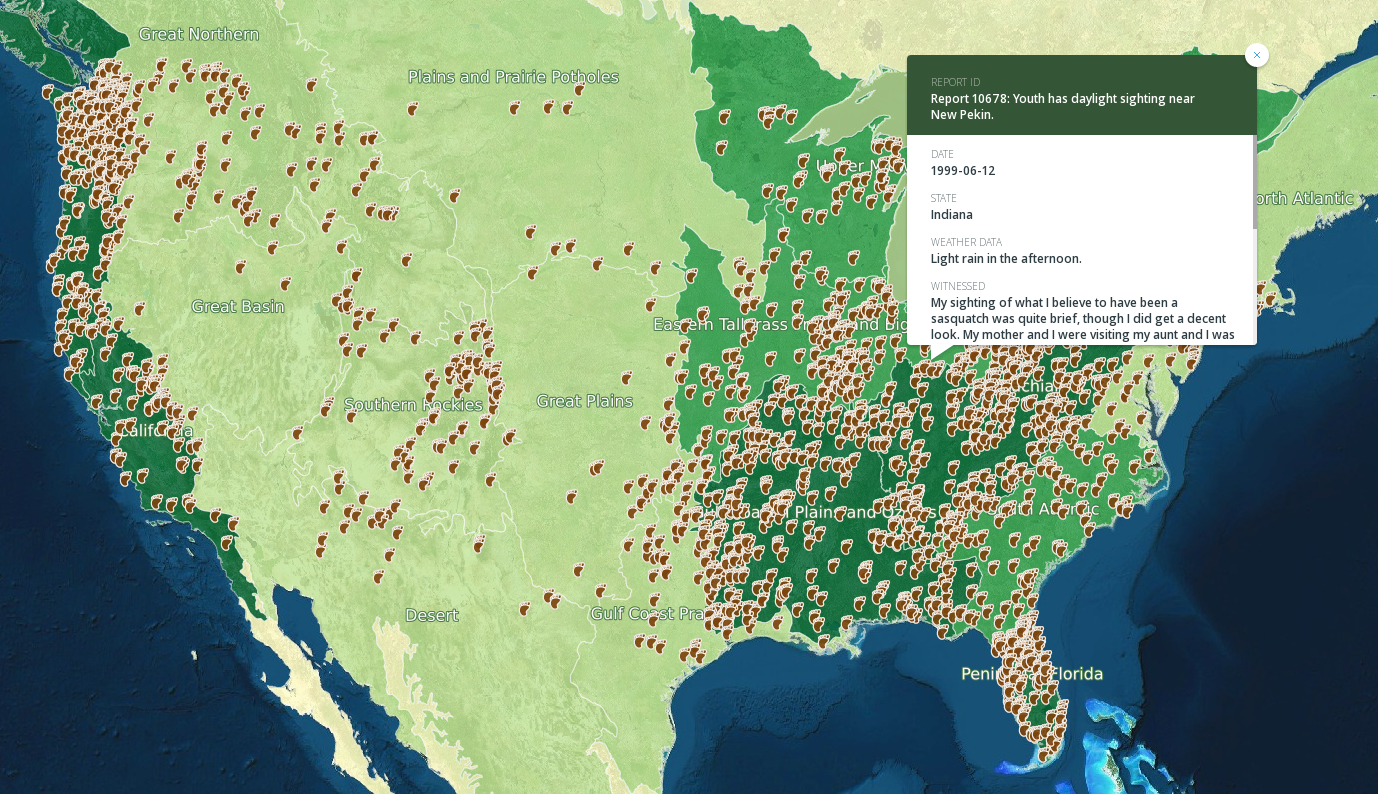
Once I figured out where Bigfoot likes to live, I knew I wanted to bring in the rich stories from the BFRO reports in order to get a better picture of the myth. I started by picking out the pieces of information I would want to display: every story has a title, a location and time, a mood, and a character that lives through a tale worth telling. I created a popup that used the report summary as the title and included the date, state, weather description, and observation. I renamed some of these categories to give the report a feeling like those late-night paranormal TV shows, such as renaming ‘observation’ to ‘Eyewitness Account.’ Since all of these pieces of information are important for storytelling, I duplicated my first dataset to create a new set specifically for the reports I wanted to display. I first cleaned out any report that was missing story-pertinent information. The BFRO has over 3,000 reports spanning 92 years, so I also cleaned out all of the Class B and Class C reports from my storytelling dataset, leaving me with 1.3k Class A reports, which the BFRO considers the most credible first-hand accounts. I was going for quality over quantity.
So I had a map with the most credible reports overlaying the Bigfoot wilderness, but using the map felt a bit difficult at first. There are still over a thousand reports to sift through and no useful way to find ones that might be interesting to see, so I added a hover popup that displayed just the summary, which helps the investigator browse for interesting stories. I also added a filter by date and a filter by state, both of which help drastically reduce the number of stories to choose from. Using the filter by state is particularly fun given the underlying map is by LCC region, so the reports draw the shape of states cutting across the landscape. To me, it gives the feeling that the borders humans have drawn over Bigfoot’s territory are pretty arbitrary. The investigator is a human exploring Bigfoot’s land.
For a splash of humor, I turned the report dots into feet. Because any map about Bigfoot that takes itself too seriously needs something to let the viewer know it’s self-aware.
This map was ridiculously fun to create. If I were to keep going with it, I’d want to find a way to dig into the weather information a bit more. How many times was Bigfoot spotted in broad daylight vs. overcast days? What about full moon vs. new moon? While the BFRO reports have tons of information, they’re missing categories that I wish they had, such as whether physical evidence was collected, a category of person who made the report, and links to news articles or video if any, or even a link to the report on the BFRO website. Particularly if links to sources were available, this map could become a great launching point for a budding Bigfoot investigator. Also while looking for Bigfoot information, I found a dataset of UFO sightings in the US. Is there a correlation between the two? Do people in Washington and Florida have nothing better to do than hunt for paranormal creatures? The world has a right to know!
The post Bigfoot Nation: An exploration of Bigfoot legend in the American wilds appeared first on Information Visualization.