The California Gold Rush: 1848 – 1855
July 3, 2018 - All
Introduction: Choosing A Topic
Learning about formatting a timeline, I selected a topic quickly the first class to start exploring the features and by the second cIass realized I’d like select a topic a little more relevant to myself and/or places I’ve lived. I lived in Oakland for many years and decided to make a timeline that explored a part of California’s history. I thought the Gold Rush would be a worthwhile subject as it shaped the Bay Area significantly. It’s a subject I learned briefly about it in grade school as a part of America’s history amid the creation of the transcontinental railroad and was surprised to see what facts I already knew and what I didn’t. The Gold Rush was a chaotic burst of historical events spanning 1848 through 1855 and I selected seven of these defining moments to form my timeline.
Tools: Knightlab’s TimelineJS
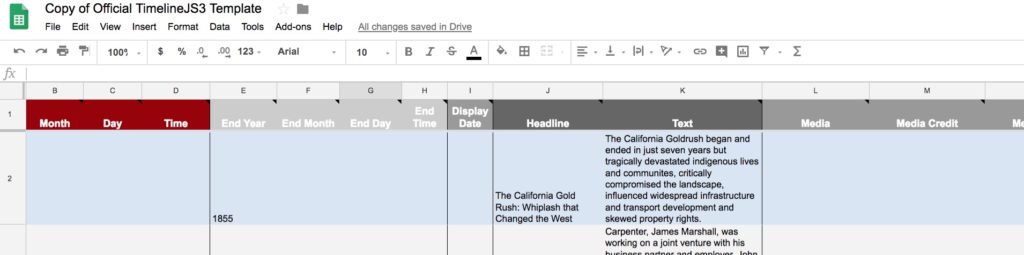
The timeline was created using Knightlab’s TimelineJS. One of many tools created by NorthWestern’s designers and developers, it’s an easy way for creating shareable timelines that can be site embedded. I began by visiting Timeline Js’s site and following the clear step by step prompts. The first was to download a spreadsheet which serves as the template for my timeline. It had a test line below the column so a first-time user, like myself, could see what each row of information would translate to on the timeline. Even without this aid, the spreadsheet is very straightforward. Fields like: year, end of year, headline, text, and media were clear in their purpose.

At the same time however, there is a limit to how much the format can be changed outside of how it’s embedded in a site. It reminded me of Squarespace site templates where it’s very user friendly if the packaged format suffices but a certain degree of coding is needed to adjust the layout if it doesn’t. TimelineJS does allow for helpful, small personalization like inputting hex codes easily for colored backgrounds or inserting an image link instead for an image.
Gathering Information – The California Gold Rush
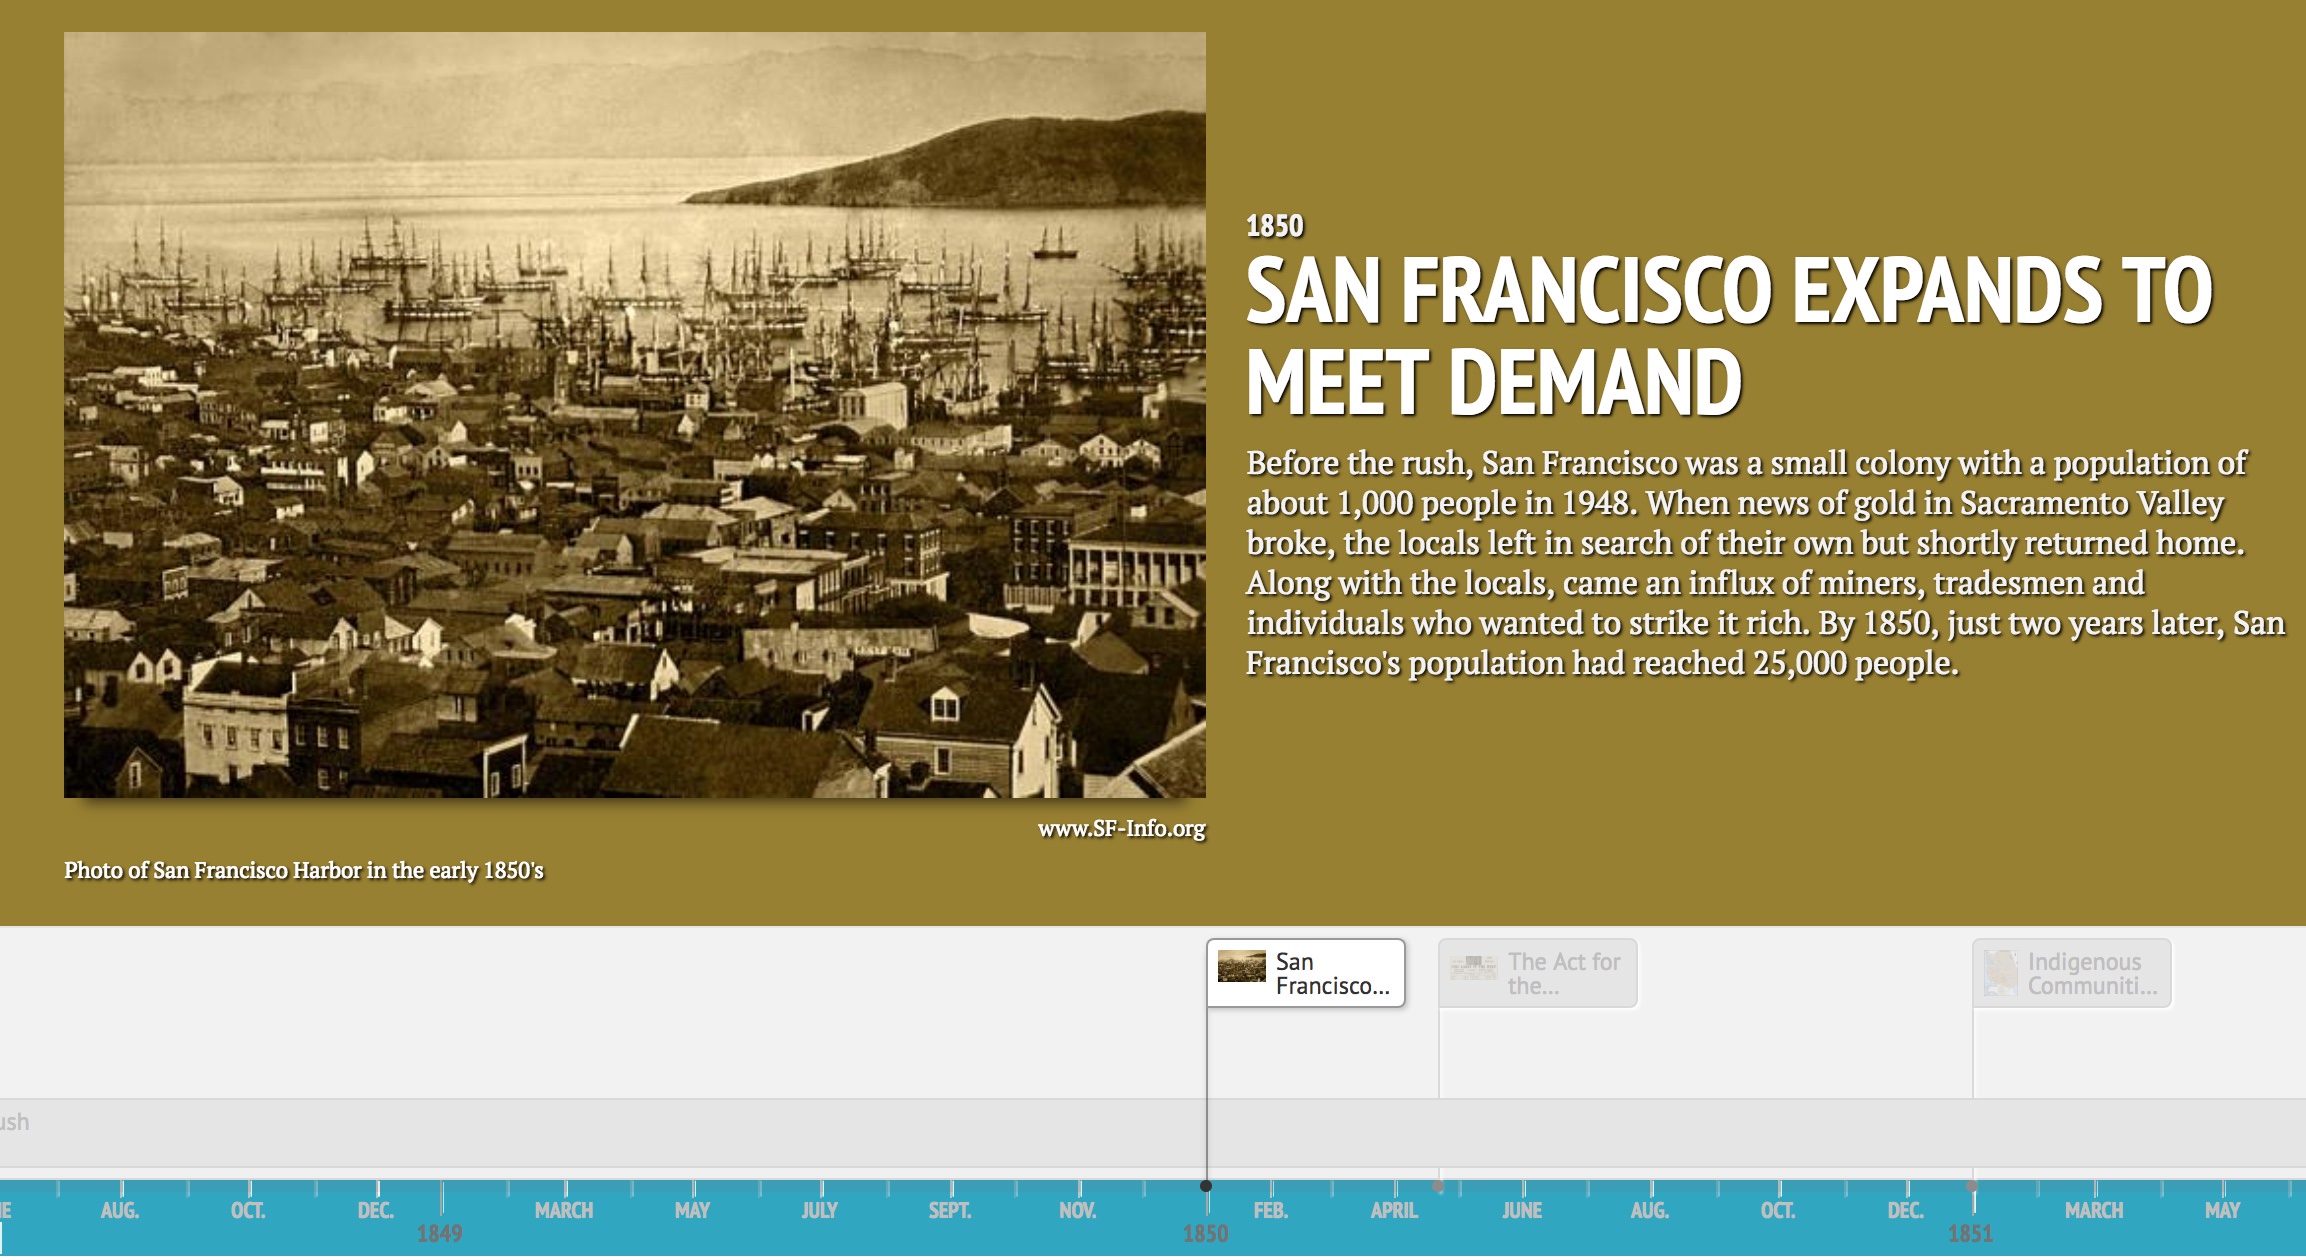
I started a general read on the California Gold Rush on Wikipedia. From there, I would follow the cited links or search specific events separately outside of the Wiki page for more clarity on specific events I wanted to include. The timeline format has space for media (photo or video), a header, and event text which are positioned in the center of the site and below this information is a timeline bar. TimelineJS doesn’t limit the amount of text you can input. If the text reaches the timeline below, it will allow the user to scroll through to read it. At the same time, the positioning of the centered text box calls for limited text, anywhere from one to five sentences. I tried to condense my information to create a snapshot of the event I was portraying. I would have liked to do more research on certain areas of this period but still left learning more than I knew when I began.
Timeline Results
I had a refresher on the Gold Rush and learned in depth how it impacted not just America as a whole but the core of California. It was also a practice in determining what side and how much of the Rush I wanted to portray. I kept colors to a minimum, using California state colors: blue and gold(-ish). I considered Few’s color advice in “Common Pitfalls of Dashboard Design” for minimal and purposeful palettes that wouldn’t detract from the data. I decided to stick with two colors, which even then may have been too much. I initially used an array of colors but given the topic and the number of slides, felt unrelated and haphazard.
Overall, using TimelineJS was an easy-to-use and interactive experience. It clearly relayed its limitations, for example when I wanted to denote an era I had left out an end date and the embed link immediately prompted me for this missing information. In the future I would be more limited in the amount of text I use and instead, include more events. Ultimately, TimelineJS allowed me to produce a straightforward and visually stimulating timeline to review this part of history.
My TimelineJS Link: The California Gold Rush
Resources:
The post The California Gold Rush: 1848 – 1855 appeared first on Information Visualization.