Look at the Time
July 3, 2018 - All
View the timeline: Look at the Time: Different methods of marking time through data visualizations
I started with a goofy idea, a timeline of timelines, in the vein of Marshall Eriksen:

Marshall’s visualizations are pretty specious, but I think I was able to successfully compile a handful of information visualization milestones that illustrate ways we can visualize time.
I used the links provided in class as a jumping off point, noting down events that might fit my theme. From there, I evaluated each event on its suitability for the theme. Was it really a method of visualizing time, or did it just merely have time as an aspect of the data? My initial list of events included milestones such as Huygen’s chart of Graunt’s life table, which visualized the median expected lifetime for a person at a given age.
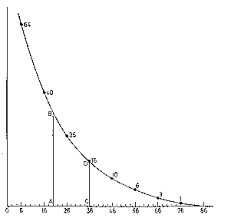
While the graph did seem to show time in a way—the time a person can expect to have left in life—it was ultimately not a visualization of the flow of time and was culled from my list. Similarly, time-series related milestones were removed from the list. It became clear I picked up on time just because they had the keyword “time” in them.
Once I had decided on the six milestones I was going to use, I went to research them in more detail. I read Wikipedia pages, the sources listed from both the datavis.ca site and the Infographic timeline site, and tried to search for other sources as well. While I could’ve researched more deeply and included more background, the Timeline JS format is such that anything more than a short blurb would be overkill.
I put together a timeline that included six milestones. Three of them are historical timelines and the other three represent different ways to visualize time. Priestley’s two historical timelines could have been collapsed into one event, having been created just a few years apart and by the same author, but I felt each of the visualizations deserved their own full illustration. A limitation of the TimelineJS interface is that each event can only have one piece of media accompany it. I did the opposite for the train schedule visualization. Lt. Serjev and Marey’s train schedules are technically separate events, but I opted to group them together to better provide context for the two milestones as they’re understood in the history of visualization. I’ll admit I was surprised to notice a connection between Priestley’s New Chart of History and the Gantt chart, but some of the visual and conceptual DNA from Priestley’s chart seems to have made it’s way into Gantt’s.
For the design itself, I kept it simple. I stuck with an image of the visualization and a short summary of what it was showing. I initially wanted to stick with plain white backgrounds for my slides, but then found a fitting image for the title card. I took the colors from the abstract timeline in the title card and used those as background colors for each of the milestones.
If I were to expand this, there are two directions I’d be interested in going in. One would be the more recent history of interactive timelines and the technologies that have made them more accessible and personal—a couple examples might be the infamous Facebook timeline, or even tools like TimelineJS itself and the technology it’s built on. The challenge in documenting digital and web timelines and technologies would be the dispersed nature of the web and the difficulty of really tracking down the “first” of any example. The other direction would be a look into temporal data. While researching Debourg’s Carte Chronologique, I came across dataphys.org, a site that catalogs physical data visualizations, including several examples of work created to visualize temporal data. Temporal data is not purely a visualization of time, but time is a crucial aspect of the data itself. While it may not exactly fit in with a “timeline of timelines,” it could certainly be a complementary timeline in itself.
The post Look at the Time appeared first on Information Visualization.