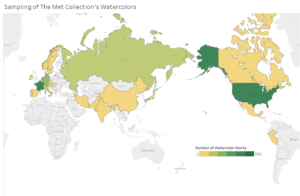
Sampling of the Met Collection’s Watercolors
August 6, 2018 - All
Watercolors at the Metropolitan Museum of Art
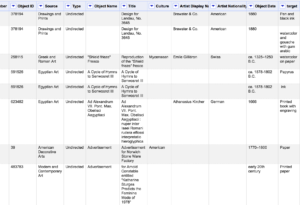
This final visualization presents the watercolors that are held at the Metropolitan Museum of Art. While the Met’s open dataset contains 467,665 items, the disarray of the records made it impossible to capture this breadth of information in such a condensed amount of time. I had originally hoped to create informative overarching visualizations of the Met’s entire holdings. However, this was quickly decreased to their holdings that contained paper, or paper-related material, which narrowed it down to 184,284 items. As I began cleaning this data, the amount was decreased again to just watercolors, since I had been moving backwards through their collection.

After a few days of homogenizing the object type descriptions to simpler terms, such as ‘album,’ ‘drawing,’ etc., I found that I had to go back through the entire watercolor collection again to simplify the medium column. Each item was recorded using a wordy, overly descriptive, string of text. This process was extremely time consuming and took many days. For this reason, I had to narrow the dataset even further to watercolors containing mediums that start with letters that fall between A and G, which ended up being about half of the Met’s watercolor collection. Once these 5,000 or so cells had been cleaned one by one through OpenRefine, I had to again go through the dataset for a final time: separating the surfaces from the mediums; simplifying the surface titles to make them more cohesive; recording the missing countries for each piece based on the artist’s nationality or the given culture; and changing the sporadic recordings for dates as centuries to whole year numbers, such as 1800, 1850 or 1900. Items that did not contain Object Type, Date, Country, Medium or Surface were removed from the dataset.
While my final dataset ended up containing a mere 5,588 records, around one percent of the original total Metropolitan Museum collection, I was still pleased that I was able to create a sampling of the Met’s watercolor holdings. Since my History of Art master’s thesis related to a print held at the Met, it was important for me to create visualizations for students and researchers like me, who have an interest in art on paper, as well as the general public, who may be curious as to the origins of these artworks and the kinds of works that are held within the Met’s vast collection. I personally wanted to know, apart from the United States, which I assumed would dominate the collection, what countries around the world made up the Metropolitan Museum’s watercolors. I also wanted to see the contrast in the use of ink, graphite, wash and chalk over time, as these mediums were used in the print for my thesis. I assume that graphite, and perhaps ink, were used primarily. I look forward to discovering these results.
Design Process
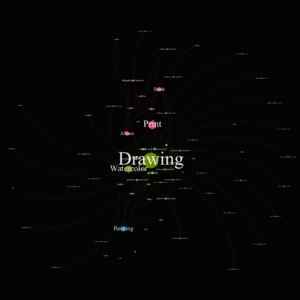
I chose to use two different softwares in my final project, Gephi and Tableau, in order to make an informative dashboard of my Sampling of The Met Collection’s Watercolors. I believed that a network of the watercolor sample that I was able to clean would be of interest. I made the Object Type (album, drawing, book, etc.) the source, the Medium (graphite, ink, watercolor, etc.) the target and the Surface (wove paper, laid paper, cardboard, etc.) the weight, so there were 12,060 total items. I struggled creating this network with this messy and text heavy dataset. I was grateful to receive Professor Sula’s help preparing the dataset for Gephi with an OpenRefine transpose for the pieces that contained multiple mediums. For some reason during a transpose, 17 of the mediums were listed as ‘Directed,’ instead of ‘Undirected,’ because some of the Weight column doubled over onto the Type column in the dataset in OpenRefine right before I sent the csv to Gephi. Nevertheless, I fixed this problem in excel and then the data laboratory showed an undirected edge table. I ran the statistics and then used Force Atlas 2. This time, there were some nodes that were very far away from the center so I set a range degree in filters, so that it ran from 3-49. I also limited the edge weight to 1.0. I based the node size on degree and the colors on modularity class of the nodes.
One of the Tableau visualizations that I created was a map relating to which country the watercolors originated from, and the different types of surfaces that were utilized in those countries. I created a choropleth map based on the total amount of works for each country. I had a very hard time excluding all of the null values from the pop up for the countries from where the Met did not have watercolors with a particular kind of paper. After selecting exclude and hide null values, attempting to only show items with values over 0, and going back and forth on the Tableau community forums, I finally came across this helpful link. I found the second formula, or the IF SUM formula, to work and I put it in for each type of surface in my dataset. I was very pleased with the end result.
Another Tableau visualization was a line graph that shows the use of different mediums over time. Again, this was a slightly laborious process in that I had to compute the totals of each type of medium per half century. I first used the text facet per year and medium in OpenRefine, but this took a lot of time, so I switched to a pivot table in excel. Once I had created a csv table of the totals for each medium over half century time slots, I imported the dataset into my Tableau final project and created the line graph.
Finally, I created a stacked bar chart with this same dataset so the viewer could compare the percentage of different mediums used, again broken up into half century intervals. I added an additional column with the total amount of mediums for each year. I then sent this updated csv to Tableau and created calculated fields of the percentage of each medium per total number of works for each half century interval. I put the measure names in the color filter, the measure values in the rows and the dates in the columns to create a stacked bar chart.
User Experience Survey
I was able to find five users to view my project at different intervals of completion. I was able to recruit a friend, my cousin, my brother and my parents, since I have been visiting them in Minneapolis while I have worked on this project. The surveys I conducted were a combination of talk alouds and interviews. I began each UX study by giving a summary of what the study and the visualizations were about, but then allowed my users to interact with the visualization(s) that I had completed at the time of each survey. In conclusion of each survey, I asked each user what they found interesting and what they believed could be improved upon.
Design Rationale
For my Gephi Watercolor visualization, I thought that making the size of the nodes dependent on degree would allow for users to understand the quantity of each kind of object type in the Met’s watercolor holdings. Expressing modularity class through the color of the nodes and edges would show groupings within these object types to users as well. The spacing between nodes allowed for the labels to be legible and there was little overlap. Simplifying this wordy dataset, and instead displaying it through this visualization, increases both comprehension and interest in understanding the associations between different items in the collection.
My tableau visualizations were highly dependent upon color and simplicity, too. The choropleth map allowed me to show the total values per country, while the pop ups were an optional added feature for further information should the user choose to know more about the papers used in a specific country. The graphs use color to distinguish between mediums while the axes were simplified with dates being grouped into half century chunks and the the amounts were general medium totals, or percentages, for said time interval. Again, should the user wish to know more, the pop ups reveal info for the amount of any single medium. The user can either compare the medium’s growth over time or compare one medium with another in the percentage columns.
Visualization and UX Research Findings
I was pleased with my visualizations, though I wished the dataset would have been cleaner to begin with so I could have created visualizations for a wider range of artworks. I was incredibly surprised at how long it took me to clean only a small portion of the dataset. It was also challenging working purely with text, instead of numerical data. This added to the time it took to numerically tabulate a large amount of text data. At the same time, I was interested with my findings. The use of different mediums over time line graph answered my question that, apart from watercolor, gouache and then ink were predominantly used, whereas graphite had a smaller amount of use around the first half of the twentieth century. The map showed me that, apart from the US, France and then Germany had a large amount of watercolors at the Met. I was also surprised by the large amount of Russian watercolors. I was slightly taken aback by the network visualization, in that there were more drawings than prints and that there was such a large quantity of paintings. Again, I wish the dataset had been cleaner so that I could have looked beyond watercolors.
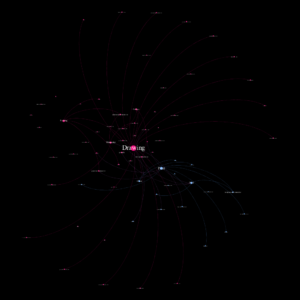
My UX research findings were incredibly helpful in designing my visualizations. My friend’s feedback was helpful with the dataset for Gephi, by cutting the wordy dataset down to a sampling made the amount of material at the Met more approachable for users. My cousin, who is himself an artist, gave good feedback, which I utilized in my visualizations. For the network he preferred a black background with white lettering. I agreed with him that this made it easier to see and read. My brother suggested that I use the green and gold color scheme for my choropleth map, as it allowed the user to see the gradients better. My cousin suggested that I make this into 5 color intervals. I made both of these suggested changes. Finally, my parents thought that the area map was too busy. For this reason I changed it to a line graph. However, all of the tested users were interested in the subject matter and appreciated the pop up information and the zoom feature on all of the visualizations.
Recommendation for Revision Based on Findings
If I had further time to work on this project, I would be able to have finished editing the other half of the watercolors dataset and possibly have included more types of art on paper, which were cut during my first second weed of the immense Met open dataset. Another possibility, were I able to start over, would have been to find a smaller or cleaner dataset to begin with, allowing me to put more time and energy into the actual design and info vis aspect of the project. Battling such a large and unruly dataset was incredibly time consuming and tedious. However, with more time it would have been interesting to create a story map of the Met’s paper collection. I would have liked to include info vises similar to the ones I have made for this project, but with a larger amount of items, apart from watercolors. Including additional images and some art historical information to accompany the maps and graphs could have added a richer and deeper look into the Met’s art on paper collection. Be that as it may, I am incredibly proud of what I was able to create considering the unruly nature of the dataset. I am grateful for being given additional time to complete this project and appreciative of all of the help I received. It would have been impossible for me to have finished it any sooner.
The post Sampling of the Met Collection’s Watercolors appeared first on Information Visualization.