A Timeline of the History of GIS
September 12, 2018 - All
Introduction
GIS, short for geographic information systems, is a system that was designed to better understand geographic data. With the help of GIS applications, users are aided in analyzing spatial information, creating searches for data, and interpenetrating maps with slightly more ease. While it would seem obvious that a lot of the emergence of this technology came to rise with the creation of computers and processing, this project wanted to look at the roots of this technology. By using TimelineJS, this study will look at what could have been the spark for the technology today as well as how this technology came to exist.
Materials
In order to create my timeline the following two tools were utilized:
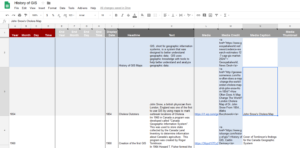
- Google Sheets – Google Sheets was used in order to organization the data and where the majority of the process took place. Using a sheet provided by TimelineJS, I was able to input my findings into the desired location.

- TimelineJS – TimelineJS is an open source software that converts the information placed in the Google Sheet and turns it into a timeline. This site provided the sheet that was used to input the data.
- Informational Websites – These sites helped me in deciding which information to use in my timeline and if the information was considered true by multiple people. These sites can be found in the reference section of this study.
Methodology
- Finding the information – The first thing that was done was find the information that would be used to create the timeline. While that sounds easy enough, I knew next to nothing previous to this study so finding the information required looking at multiple sites to see what information was out there and what seemed to be the general consensus.
- Inputting the data – Thanks to the easy sheet provided by TimelineJS it was easy to input the data into the Google Sheet as well as easy to create a new row if new information arose.
- Adding the media – In the sheet provided by TimelineJS, there was also spots to incluindex.html?source=1xg0hYgcZvOr58zj1Ba1uDsHMm5vzBs7OE48RSH7QCHs&font=Default&lang=en&initial_zoom=2&height=650de media so the next part became finding images to go along with the timeline and adding them into the program.
- Creating the timeline – With TimelineJS creating the timeline meant just plugging in the link to the dataset and having it generate the timeline.
Results
Reflections
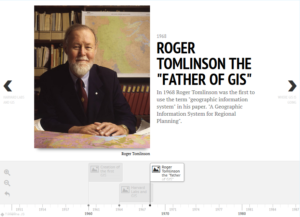
With the information used founded it was easy to see the roots of where GIS started as well as see the boom of the technology in the 1960’s thanks to the cluster of data on the timeline. When creating a timeline like this, using TimelineJS was a very useful tool because it was user friendly. With this tool it was easy to input new data onto the chart but just sticking it into where it needs to go, though it still even works without of place data (so long as the numbers work right). This program made it easy to create a uniformed timeline professionally and quickly with minimal errors.
References
The post A Timeline of the History of GIS appeared first on Information Visualization.