Fast-Food vs. Vegetarian + Vegan Food Options In the US

December 14, 2018 / 0 comments

by JiSun Hong & Christine (Ye Eun) Sun Introduction Our objective was to show the number and location of fast food restaurants in contrast to fully vegan or vegetarian restaurants in hopes to learn about the relationship between the regions that have more vegan or vegetarian restaurants available. We wanted to visualize it to see…

Read more →

Marvel Universe Visualization

December 14, 2018 / 0 comments

UNKNOWN LOCATION, DC – FEBRUARY 17: Marvel Comics Publisher, Stan Lee, poses with a book of “Spider Man” comics which he created along with comics on the “Hulk” and others. Photo from Washington Post Archive scanned on 2/17/2009. (Photo by Gerald Martineau/The Washington Post via Getty Images) Written by Wen Chen, Pei Liang and Xingya…

Read more →

NYC Shooting Incident Data 2013-2017

December 14, 2018 / 0 comments

Introduction For this final project I wanted to continue using New York City crime data to further expand upon projects I had done earlier in the semester. My first lab report that dealt with crime data looked specifically at data about felonies committed in New York City parks across all five boroughs from 2016-2017. This…

Read more →

Personal Citibike Usage

December 4, 2018 / 0 comments

Introduction: Citibike is the shared bike service that covers most of Manhattan and northern Brooklyn in New York City.  For me, it is used primarily for local short transit, as I use my own bike for longer rides.  This visualization captures starting and ending points over a three month period of my personal Citibike usage. …

Read more →

Mapping NYC Libraries Impacted by Rising Sea Levels

December 1, 2018 / 0 comments

INTRODUCTION Although New York City is home to hundreds of cultural institutions, this study will focus specifically on NYC’s public library systems (New York Public Library, Brooklyn Public Library, and Queens Library), which include over 200 locations. Conservation of the (nearly) 53 million items housed in the NYPL system alone is under continuous discussion, especially…

Read more →

Distribution of Cultural Related Institutions in New York City

November 30, 2018 / 0 comments

Introduction In the earlier assignment, I used Tableau Public tool to visualized the museums and related Organizations in the United States. As the student of Museums and Digital Culture program, at the same time, as I mentioned earlier, in the consideration of that museum undertaking the huge responsibility in our society, I would love to expend…

Read more →

San Francisco’s Restaurant Inspection

November 30, 2018 / 0 comments

Introduction San Francisco is famous for its restaurants and food trends. Along with its iconic Golden Gate Bridge, scenic streets, and booming culture, one of it’s main attraction is food. Often times, important housekeeping things may be overlooked in the food industry in the fast paced modern culture. To keep the food quality healthy and…

Read more →

Schools Under Construction in NYC

November 30, 2018 / 0 comments

Introduction We use maps to display information in a way that is meaningful and geographically related. Usually, maps need to be precise, since people use maps to search and locate destinations. This project is about mapping active school projects under construction using Carto. Inspiration When we think of engineering projects, we know that there is…

Read more →

Visualizing Earthquakes Near The Indian Subcontinent From 2000 to 2018 Using Carto

November 29, 2018 / 0 comments

Introduction Seventeen Years after the killer 2001 quake measuring 7.7 on Richter scale shook the northwestern state of India, a resilient Gujarat rose against all odds to limp back to life. This earthquake was the most powerful to strike India since 15 August 1950. It was also the most destructive in terms of lives lost…

Read more →

Libraries Across NYC

November 28, 2018 / 0 comments

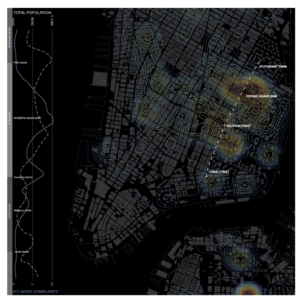
Introduction There are a lot of things New York City is known for, bagels, cheesecake, their libraries. With over 90 branches NYC has libraries for all different parts of New York. This study, however, plans to look at how these location are spread out across NYC and if the population of these areas affect the…

Read more →

Visualizing US Household Incomes using Carto

November 28, 2018 / 0 comments

Introduction The Idea I have always been really fond of maps in general and I never miss out on any opportunity to play around with them. The moment I was introduced to the tool Carto and I was shown its powerful abilities to help visualize geo-spacial data, I immediately felt the need to experiment with it and…

Read more →

Mapping Hurricane Sandy’s Impact on Brooklyn

November 28, 2018 / 0 comments

Introduction In late October of 2012, Hurricane Sandy made landfall in southern New Jersey. Sandy’s storm surge flooded parts of the city in all five boroughs in addition to every subway tunnel under the East River. The city is still feeling the effects of this surge today. As the climate changes, NYC is likely to…

Read more →

New York City Crime Mapping 2018

November 28, 2018 / 0 comments

  https://savi.carto.com/u/peko612/builder/1a23c8e7-98fc-412c-8523-cd1d3b2d8c65/embed Introduction For people who are living in New York, safety is something that we always care about. Our judgement of whether this district is safe or not often depends on the news or even stories we hear. So are those rumors truth or just bias? The best way to know it is to…

Read more →

Visualization of WWI Historic Aerial Bombing

November 28, 2018 / 0 comments

Introduction: This is a geographic about the bombing locations of the Allied Powers during WWI between 1915  to the end of 1918.   Inspiration/Dataset: Initially I thought it would be really fun to create a map about fictional worlds like Games of Thrones or Harry Potter, which couldn’t be done on Carto. Then it occurred…

Read more →

Mapping the World of Earthquakes using Carto

November 27, 2018 / 0 comments

Introduction Every year there are numerous amount of natural disasters that occur around the world: Earthquakes, hurricanes, tsunamis, tornados, wild fires and more. I wanted to focus on one natural disaster so I decided on earthquakes. Earthquakes happen because tectonic plates under the earth’s crust shifts on top of each other. This causes stored energy…

Read more →

NYC WiFi Hotspots

November 26, 2018 / 0 comments

Introduction The dataset I found is about WiFi hotspots locations in NYC from NYC Open Data website. It intrigues my interest a lot because WiFi nowadays is the crucial infrastructure in daily life. I always try to find a free WiFi when I work outside with my computer. Therefore, it would be helpful if I…

Read more →

NYC Shooting Incident Visualization

November 24, 2018 / 0 comments

Introduction For this lab I wanted to revisit an earlier project I had done using 2016-17 park crime data in New York City. However, the dataset I intended to use was not geocoded and soon realized that it would be better to use a different dataset altogether. Keeping with the theme of NYC crime data,…

Read more →

Mapping Narcotics Possession, Solicitation, and Manufacture/Delivery in Chicago (2017-Current)

November 24, 2018 / 0 comments

INTERACTIVE LINK: https://savi.carto.com/u/seth-crider/builder/bbc9a9fc-ad6a-458b-bc4e-6abb85205219/embed Introduction: In this map based visualization I was able to secure the same dataset I explored in an earlier network visualization. This dataset  is a regularly updated record of crime occurrences in the City of Chicago from the Chicago Police Department’s CLEAR (Citizen Law Enforcement Analysis and Reporting) program. The data is very…

Read more →

Exploring the correlation between fracking and seismic activity

November 19, 2018 / 0 comments

Introduction On September 3rd, 2016, a 5.8 magnitude earthquake rattled north-central Oklahoma, making it the largest quake to hit the state in its recorded history. Like most of the midwest and the south, the region is not particularly prone to seismic activity, but it had been experiencing a rise for the past several years. As the…

Read more →

Flood risk in NYC: the areas & subways most at risk, and the effectiveness of the FEMA models

November 17, 2018 / 0 comments

Introduction In August of 2017, Hurricane Harvey hit the Houston, Texas area with immense impact, causing widespread devastation and unexpected flooding. Compound this with the fact that in 2015 and 2016, two other “500-year” storms hit the Houston area, and we’re faced with the fact that an area that FEMA has deemed to be unlikely…

Read more →