Fast-Food vs. Vegetarian + Vegan Food Options In the US
December 14, 2018 - All
by JiSun Hong & Christine (Ye Eun) Sun

Introduction
Our objective was to show the number and location of fast food restaurants in contrast to fully vegan or vegetarian restaurants in hopes to learn about the relationship between the regions that have more vegan or vegetarian restaurants available. We wanted to visualize it to see if there are any sort of obvious patterns or trends we can see and hopefully in the future advise users of what regions are more vegan or vegetarian friendly. We want this exercise to one day become research to support and advise cities to be more vegetarian and vegan friendly. Ultimately we want this map to be a useful tool, like a vegetarian and vegan rating and food database, for people that want to dine at fully vegetarian or vegan food places and provide information for vegans and vegetarians of informations that exceed in depth of information provided in all-food applications like Yelp. By focusing on just the vegan and vegetarian food availabilities gives our tool the advantage to be more specific in catering to the needs of the niche users of vegan and vegetarians.
With our map, we conducted user tests to observe how users interacted with our data visualization and observed what conclusions were drawn from the number of locations of fast food joints vs. all-vegetarian or vegan restaurant in the United States. Our purpose was to see how users feel and think about the type and amount of information provided and visualised and learn how users interacted with the visualization. With the feedback, our goal was to iterate and create a map that is useful and user-friendly.
Materials
- Carto Software – A platform to build location and map based visualizations
- Kaggle – Google owned database with datasets
- Excel Spreadsheet – A spreadsheet that helps look and clean datasets
- Voice Recorder – A tool to record the surrounding sound
- Word Document – A tool to take notes and write
- Adobe Photoshop – An Adobe software for image editing
- Adobe Illustrator – An Adobe software for editing vector graphics
Process
1. Searching for dataset
For our final project, we wanted to research data related to restaurants. We found interest in what information is accessible by users today and wanted to explore what else we can provide to better experiences for users. We started by searching for food related datasets. It ranged from health inspections, food choices, yelp ratings and many more. With so many different options, we found a dataset that had a list of fast-food restaurants from all over the United States. In contrast to the fast-food dataset, we wanted to compare it with vegetarian and vegan restaurants from all over United States. We wanted to map the two sets of data to see what we can learn from the number of restaurants, locations, and anything else that we might not be aware of.
2. Cleaning up the dataset
The fast-food dataset was very organized and ready to use. But vegetarian and vegan restaurants dataset had columns with unrelated information or empty fields. We opened the data in Microsoft Excel to delete information that was not relevant to our use.
3. Visualizing the map
We used Carto to visualize our data. We started by adding fast-food restaurants dataset to Carto. A lot of dots appeared on the map. We explored different style for the dots to figure out what design would allow for a quick understanding of information. Once the initial design was set, we added another layer of vegetarian and vegan restaurant dataset. There were no issues in the process of inputting the dataset. We included click and hover pop-up options to show additional information on each dot. The pop-up was added for the user to be able to see information about each restaurant they decide to explore. Our challenge was in deciding what information is most important and relevant to show for the map to be a useful tool. Once we agreed what information to display, our map was complete for user testing.
4. Conducting user research
We conducted user testings with methods of observation, think-alouds, and interviews. Through them, we wanted to learn how users interacted with our data visualization and observe what conclusions could be drawn from the number of locations of fast food joints vs. all-vegetarian or vegan restaurant. Our purpose was to see how users feel and think about the type and amount of information provided and visualized. We came up with an outline with intended users, methods, objectives, tasks, and questions that went along with the tasks. We conducted user tests with 6 participants.
Intended Audience
People who are vegetarian or vegan or people that know or has any form of connection with vegetarians or vegans.
Methods
– observation
– think-aloud
– interviews
Objective
We are conducting user tests to observe how users interact with our data visualization map and observe what conclusions are drawn from the number of locations of fast food joints vs. all-vegetarian or vegan restaurant in the US. Our purpose is to see how users feel and think about how the information is visualized and to learn what conclusions they draw from our data.
Task 1: Take a look at the US map.
1. Can you describe what you are looking at?
2. What do you think the colors of the points indicate?
3. Hover on a dot and speak out loud what you see or what you expect to see.
4. Click on the dot and speak out loud what you see or what you expect to see.
5. Upon hovering and clicking on the dots, did they function as you expected? If not, what did you expect that did not happen?
6. What are some things you learned from the map?
7. What other additional information would you like to see or know?
Task 2: Zoom into NYC.
1. What can you learn from this section of the map (in comparison to the view of the whole map)?
2. What are some things you learned from this section of the map?
5. Synthesizing and Iterating with User Feedback
We combined all our observations and responses to synthesize our findings. We received a lot of meaningful insights from user testing. By synthesizing our findings, we were able to come up with recommendations for our visualization. We took a screenshot of our Carto map and created our visualization using Adobe Photoshop and Adobe Illustrator to incorporate the recommendations.
User research notes can be found here.
Design Rationale
Tool choice:
Tools we used to create the visualization were Kaggle and Carto. Kaggle was an easy to search platform of database. The quality of data that was available seemed to be better than many other resources. There was a sense of trust with Kaggle because it is owned by Google.
We used Carto to map out data and see it as a whole in the United States but also be able to zoom into regions to get a more detailed view of regions.
Design choice:
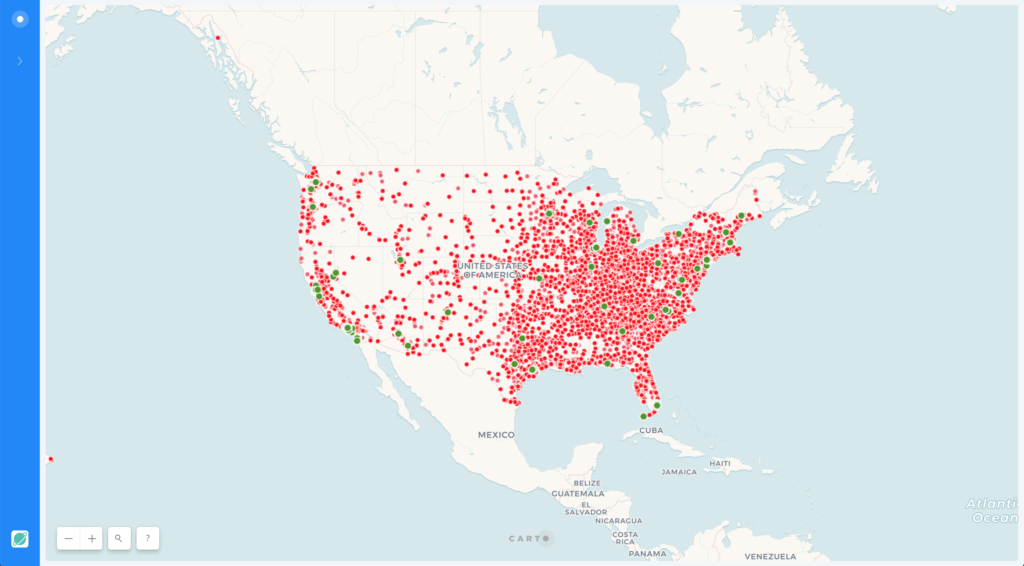
Red was chosen to indicate fast-food chains because it is commonly used for fast food chains. Green was a good representation for the vegetables. Dots were used in the map because we felt that it was the best indicator to show location clearly on the map even where there was a lot in a region. Initially we made the green dots bigger than the red to let the green show through in the densely populated red areas. We picked the style that was less distracting but still clearly shows it is a map of the United States.
Function choice:
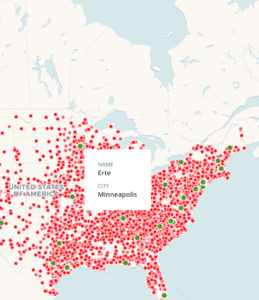
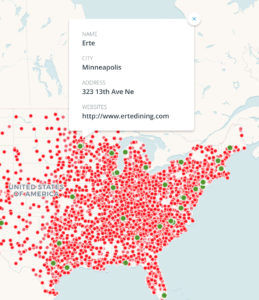
Functions we incorporated on the map were hover and click pop-up. We felt that hover was a function to be used for quick glance, quick look, summary for users to see and make the decision to look deeper into the restaurant. Click function was intended for the user to get a thorough amount of information for the user to make a decision if they wanted to visit the restaurant. For a user to commit to going would mean a user would be committing time, money, and stomach so it needed to have helpful amount of information for the user to to know what options are available, how much they would be spending, etc.
User Research method choice:
Research Types that were used were observations, think-alouds, and interview. Observation method was used to be able to view how user interacts with the map without much direction, to capture actions that are not mentioned by the user. We wanted the experience to be as pure as possible and capture their own experience to mimic any user that maybe interacting with the visualization on their own.
Think-alouds were conducted to be able to hear the users’ raw thoughts as they experienced and interacted with the map.
Lastly, interviews were done to be able to ask specific questions that may not have been covered by the user in interacting with the map, to get critical thoughts from users, to hear more in depth observations, and thoughts of the user. Questions were asked in the interviews to least impact users’ natural interaction and observation. We didn’t want the questions to give away any information in order to learn if the map alone gave enough information. We asked “why’s” to limit any assumptions by us but also to get their full thoughts.
Results
When we created the map, our initial thought was that there were a lot of red dots overpowering the green dots. We could clearly tell that the East Coast had a strong relationship with fast-food joints compared to the middle and West Coast. It was also interesting to see the comparison between the amount of fast-food restaurants and vegetarian and vegan restaurants across the US. The Carto map visualization can be accessed here.
Findings
Observations on the map
From our user testing, many users were surprised that there weren’t a lot of vegetarian or vegan restaurants around the US when looking at the map as a whole. One user stated, “I can see that the east half of the country has significantly higher density veggie restaurants and distribution is homogeneous whereas on the Westside I would say higher density along the coast as opposed to the Midwest.” When we asked our users to zoom into NYC, many thought there would be many more fast-food joints in NYC. Many were also surprised that there were many vegetarian or vegan options in NYC. One user said, “The ratio of green vs red is definitely is much higher in NYC comparing to the rest of the country.” Another user stated, “Definitely higher proportion of the green dots in the city, main in midtown, Lower East Side, East Village, Downtown and some Upper East Side, Upper West Side. Largely absent in Harlem and Bronx.”
User Research on Visualization
Upon user research, we received helpful feedback on our visualization. The following are feedbacks captured from the user testing:
- Having no visible title, all users were unsure about what the map represented
- Users had trouble figuring out what the colors and dots indicated on the map
- The difference in the dot sizes caused confusion and users thought there were reasons why the dot sizes were different
- Some users did not realize he/she can click on the dot as well as hovering
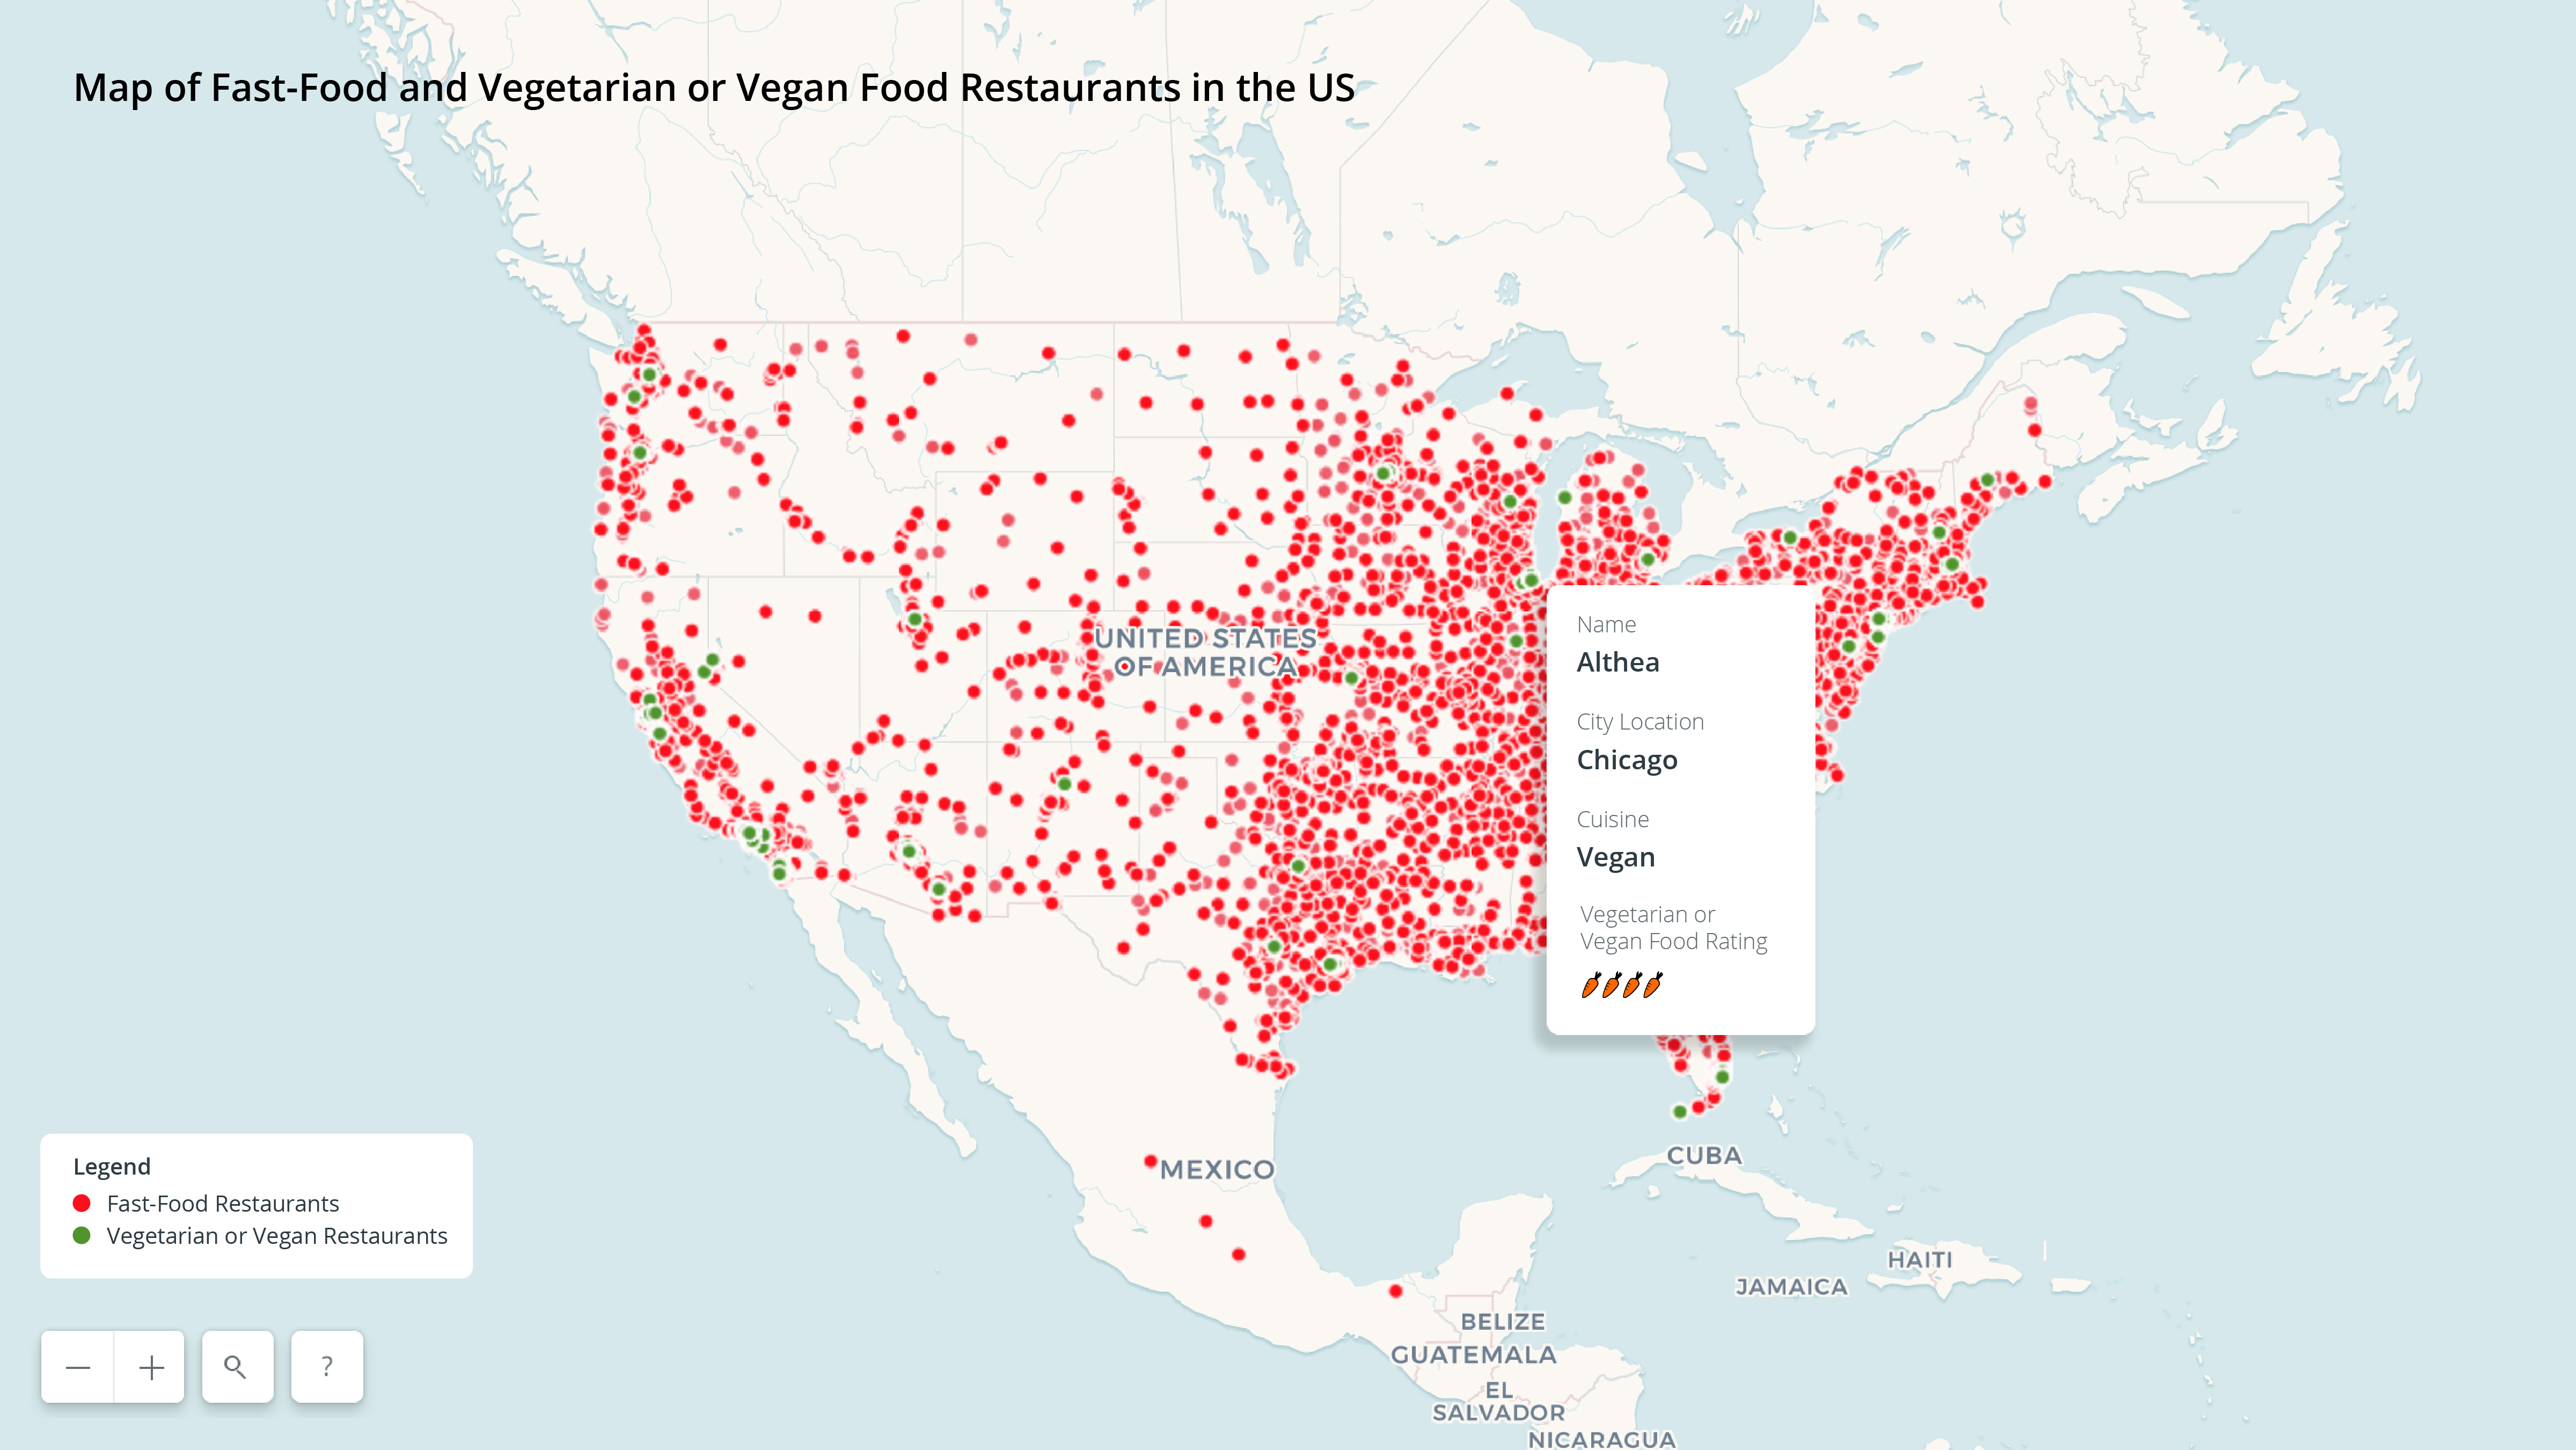
- Users felt that hover should provide less info compared to clicking. Hover should have name, cuisine, and location (city), rating of vegetarian or vegan option quality
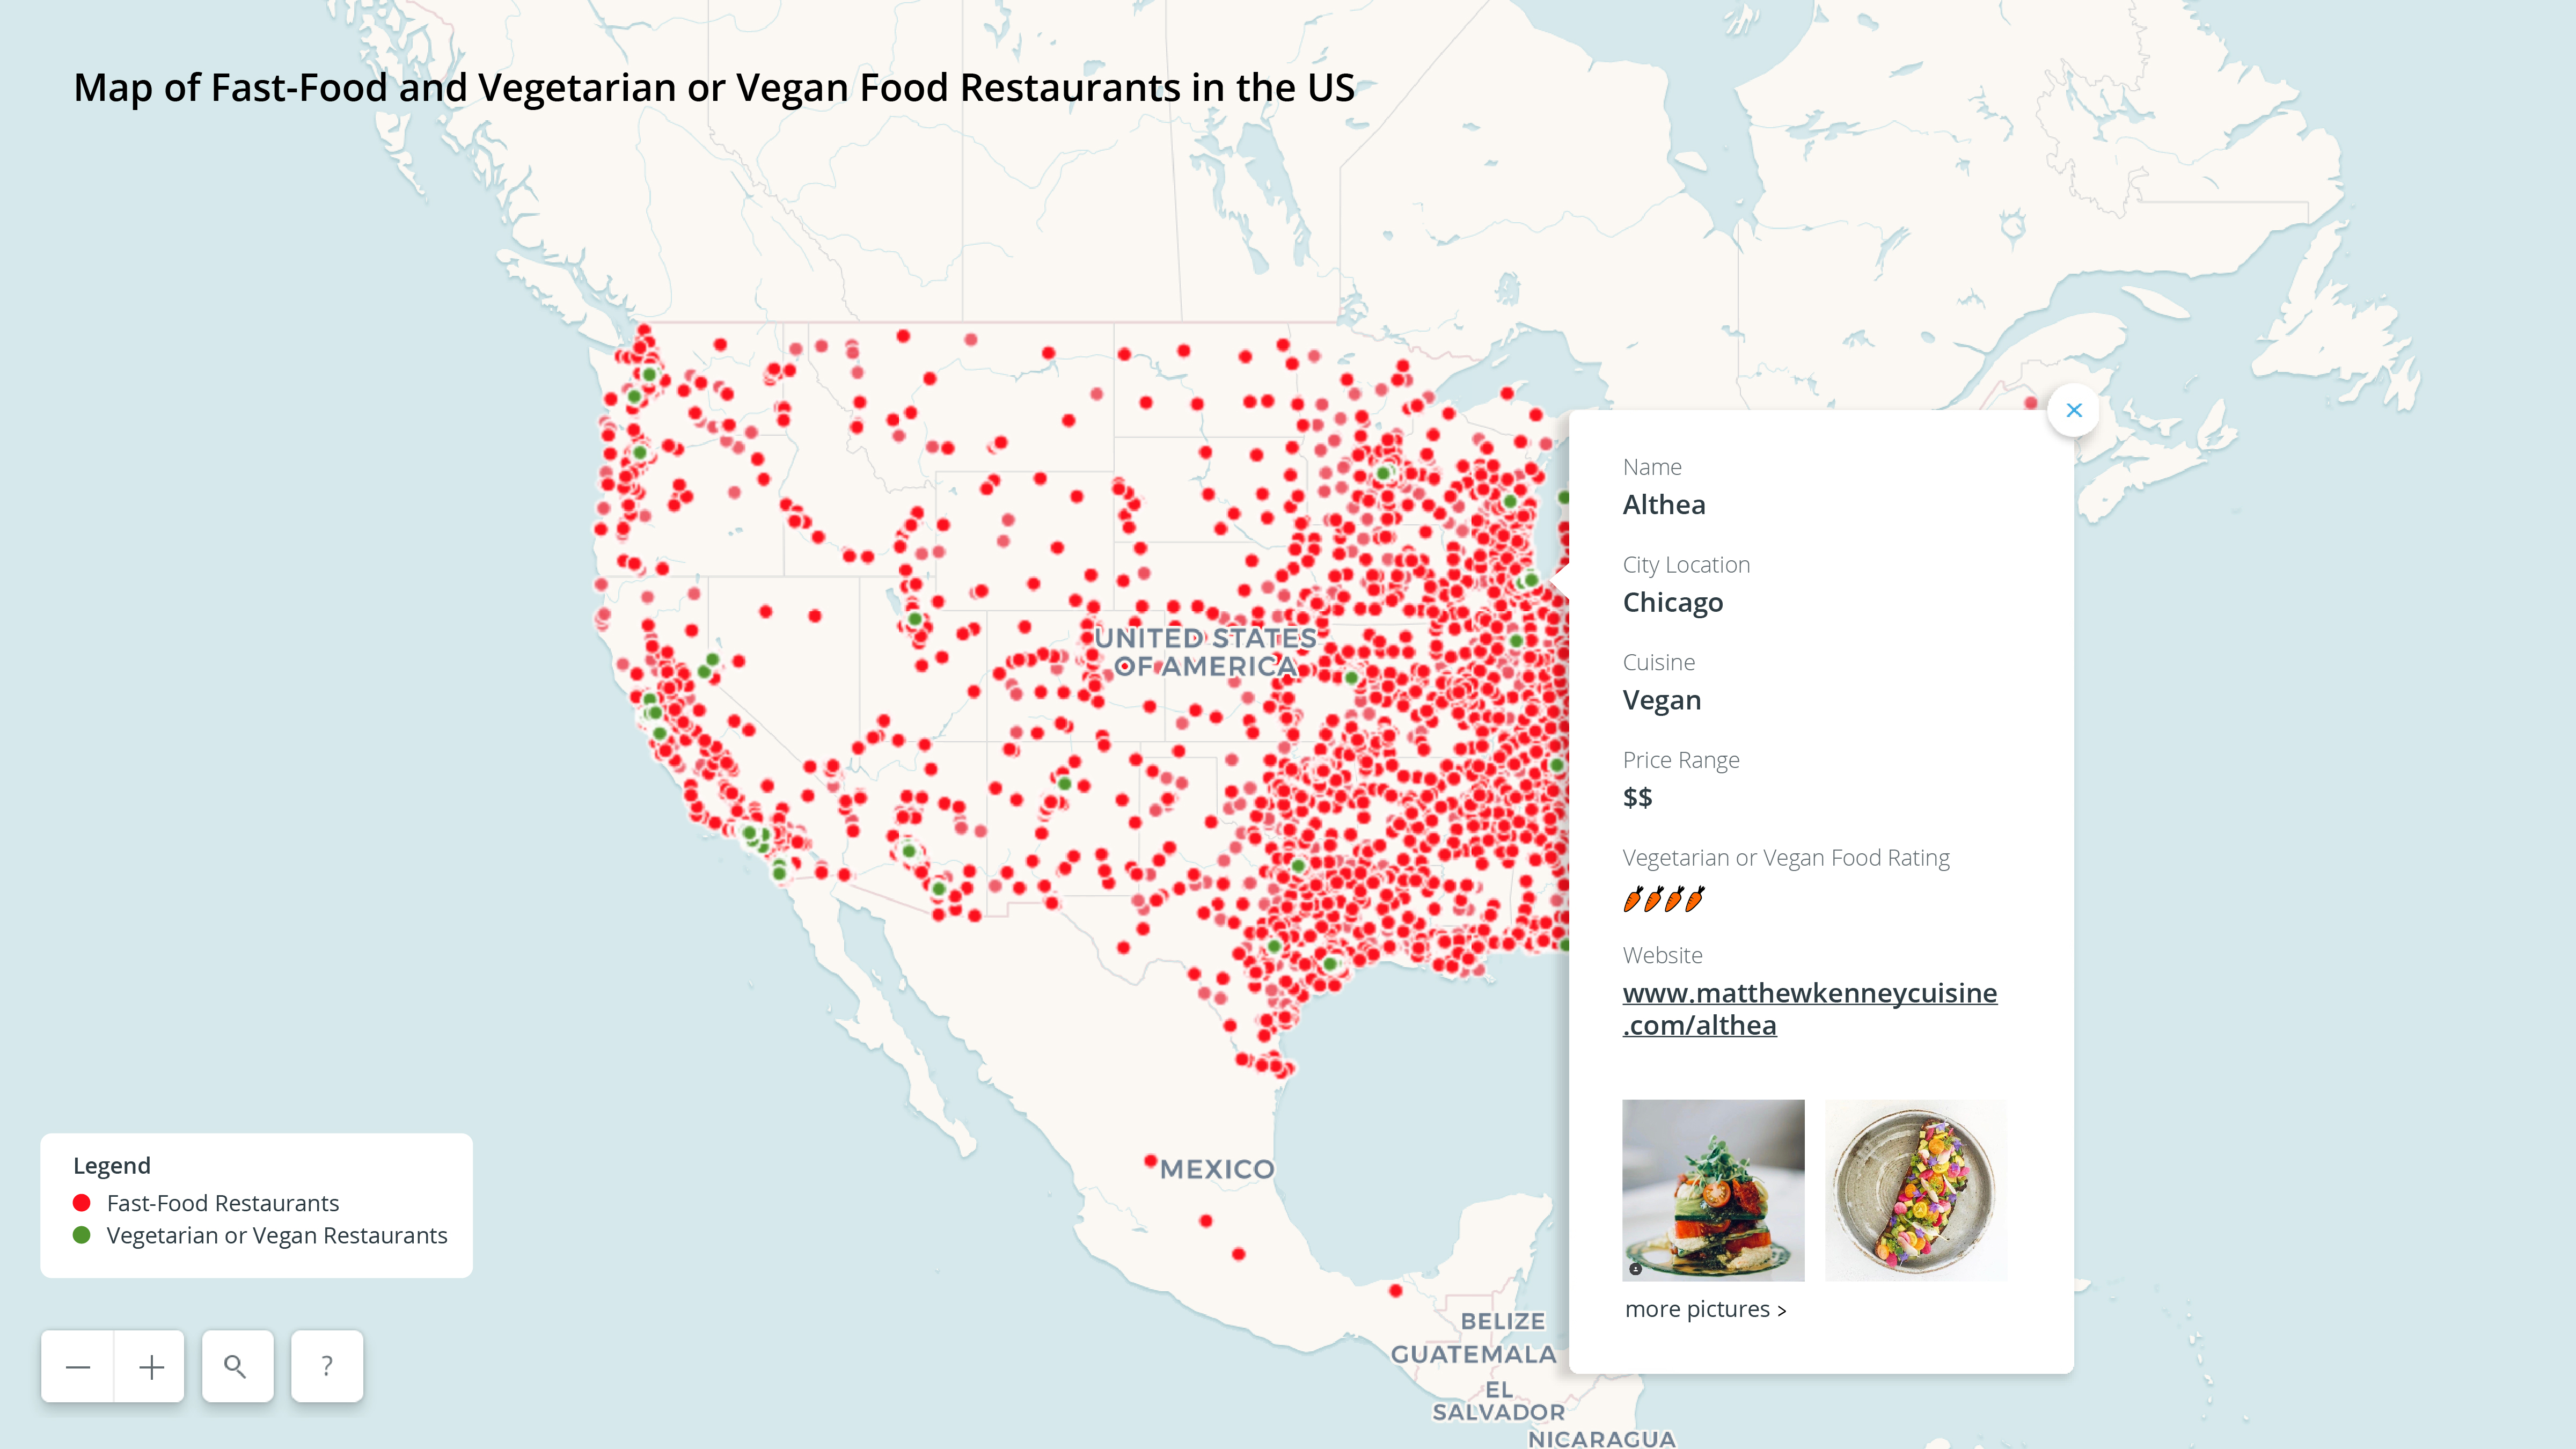
- Users felt that click should have information about cuisine, price range ($, $$, $$$…), what vegetarian or vegan options they had, rating of vegetarian or vegan option quality, website, and pictures of food.
- Users felt that name and type of cuisine was the most important information
- One user said, “I don’t know if it’s a fair comparison between fast-food restaurants and traditional dine in veggie restaurants. But I’d love to see comparison of regular dine ins restaurants vs veggie dine in restaurants.”
Recommendations
Here is the list of changes of recommendations we gathered from user feedbacks to incorporate in map to make it a more powerful tool and visual. We made some changes on Carto and some on Adobe Photoshop and Adobe Illustrator because of the limitations of Cart:
- Add a title to the map to clear confusion about what the map represented.
- Add a legend to indicate what the colors red and green mean so that the users did not have to guess what the colors and dots indicated on the map.
- Provide consistent dot size if there are no distinction or meaning behind different sizes.
- Provide direction of what the user can do on the map to clarify function of the map.
- Hover to show name, location, type of cuisine, rating of vegetarian or vegan option quality (rating) to reflect users’ feedback in what they thought were necessary information to get a high level understanding about the restaurant.
- Click to show name, location, type of cuisine, price range ($, $$, $$$…), rating of vegetarian or vegan option quality (rating), website, and pictures of food to reflect what the majority of the users felt they would want to see in order to help them make decisions on where to eat or visit.
Reflection
We created our “blue sky” visualizations using Adobe Photoshop and Adobe Illustrator because there were some function limitations on Carto. To our understanding, we were not able to add features like carrot-shaped rating systems, images, and link out to other website on Carto. Upon class and Professor Sula’s feedback, we learned that it is possible to add these functions by hard coding in the information.
Our future iteration and next steps would be to input all restaurants and food places (not just fast-food or vegan or vegetarian) and provide rating of vegetarian or vegan option quality ratings along with hard coding the following on Carto:
- Add carrot-shaped rating system via CSS on carto
- Add Legend possible by combining the excel data sheets
- Input all restaurants and food places (not just fast-food or vegan or vegetarian) and provide ratings of vegetarian or vegan food option qualities (rating) along with the following:
- Hover: restaurant name, cuisine, and location (city), rating of vegetarian or vegan option quality
- Click: restaurant name, cuisine, price range ($, $$, $$$…), what vegetarian or vegan options they had, rating of vegetarian or vegan option quality, website, and pictures of food.
- Add images via HTML on Carto
- Add hyperlinks on the website section of the pop-up
One challenge we are faced with is finding complete datasets of all the restaurants in the United States. We might have to approach this challenge by making this tool an open-source database where users start to populate the data as they visit locations and rate how the quality is of the vegan and vegetarian food options at that restaurant. Another approach would be to partner with tools like Yelp and pull the basic data to populate our tool. With that, we would incorporate user collected data for each food places they visit.
Ultimately, we want this map to be a useful tool for people that want to eat vegetarian or vegan food options and provide information for vegans and vegetarians that exceed the depth of information provided in all-food applications like Yelp (such as ratings of vegetarian or vegan option quality). By focusing on just the vegan and vegetarian food availabilities, it gives our tool the advantage to be more specific in catering to the needs of the niche users of vegan and vegetarians.
The post Fast-Food vs. Vegetarian + Vegan Food Options In the US appeared first on Information Visualization.