
History of Weather Map
September 14, 2018 - All
Introduction
Checking the weather forecast has become engrained our daily routine. We have become accustomed to accurate predictions of what temperature and weather to expect each day. The ability to know what the weather has not always been an easy access information. To know and be able to predict the weather has come a long way with communication and technology enhancements.
Today, we look on our smart phones and can see hour by hour weather updates and predictions. My research is on the history of the weather map to explore how this every day accessed information has come to be a so easily accessible to the point we look it up like we check our social media accounts or emails.
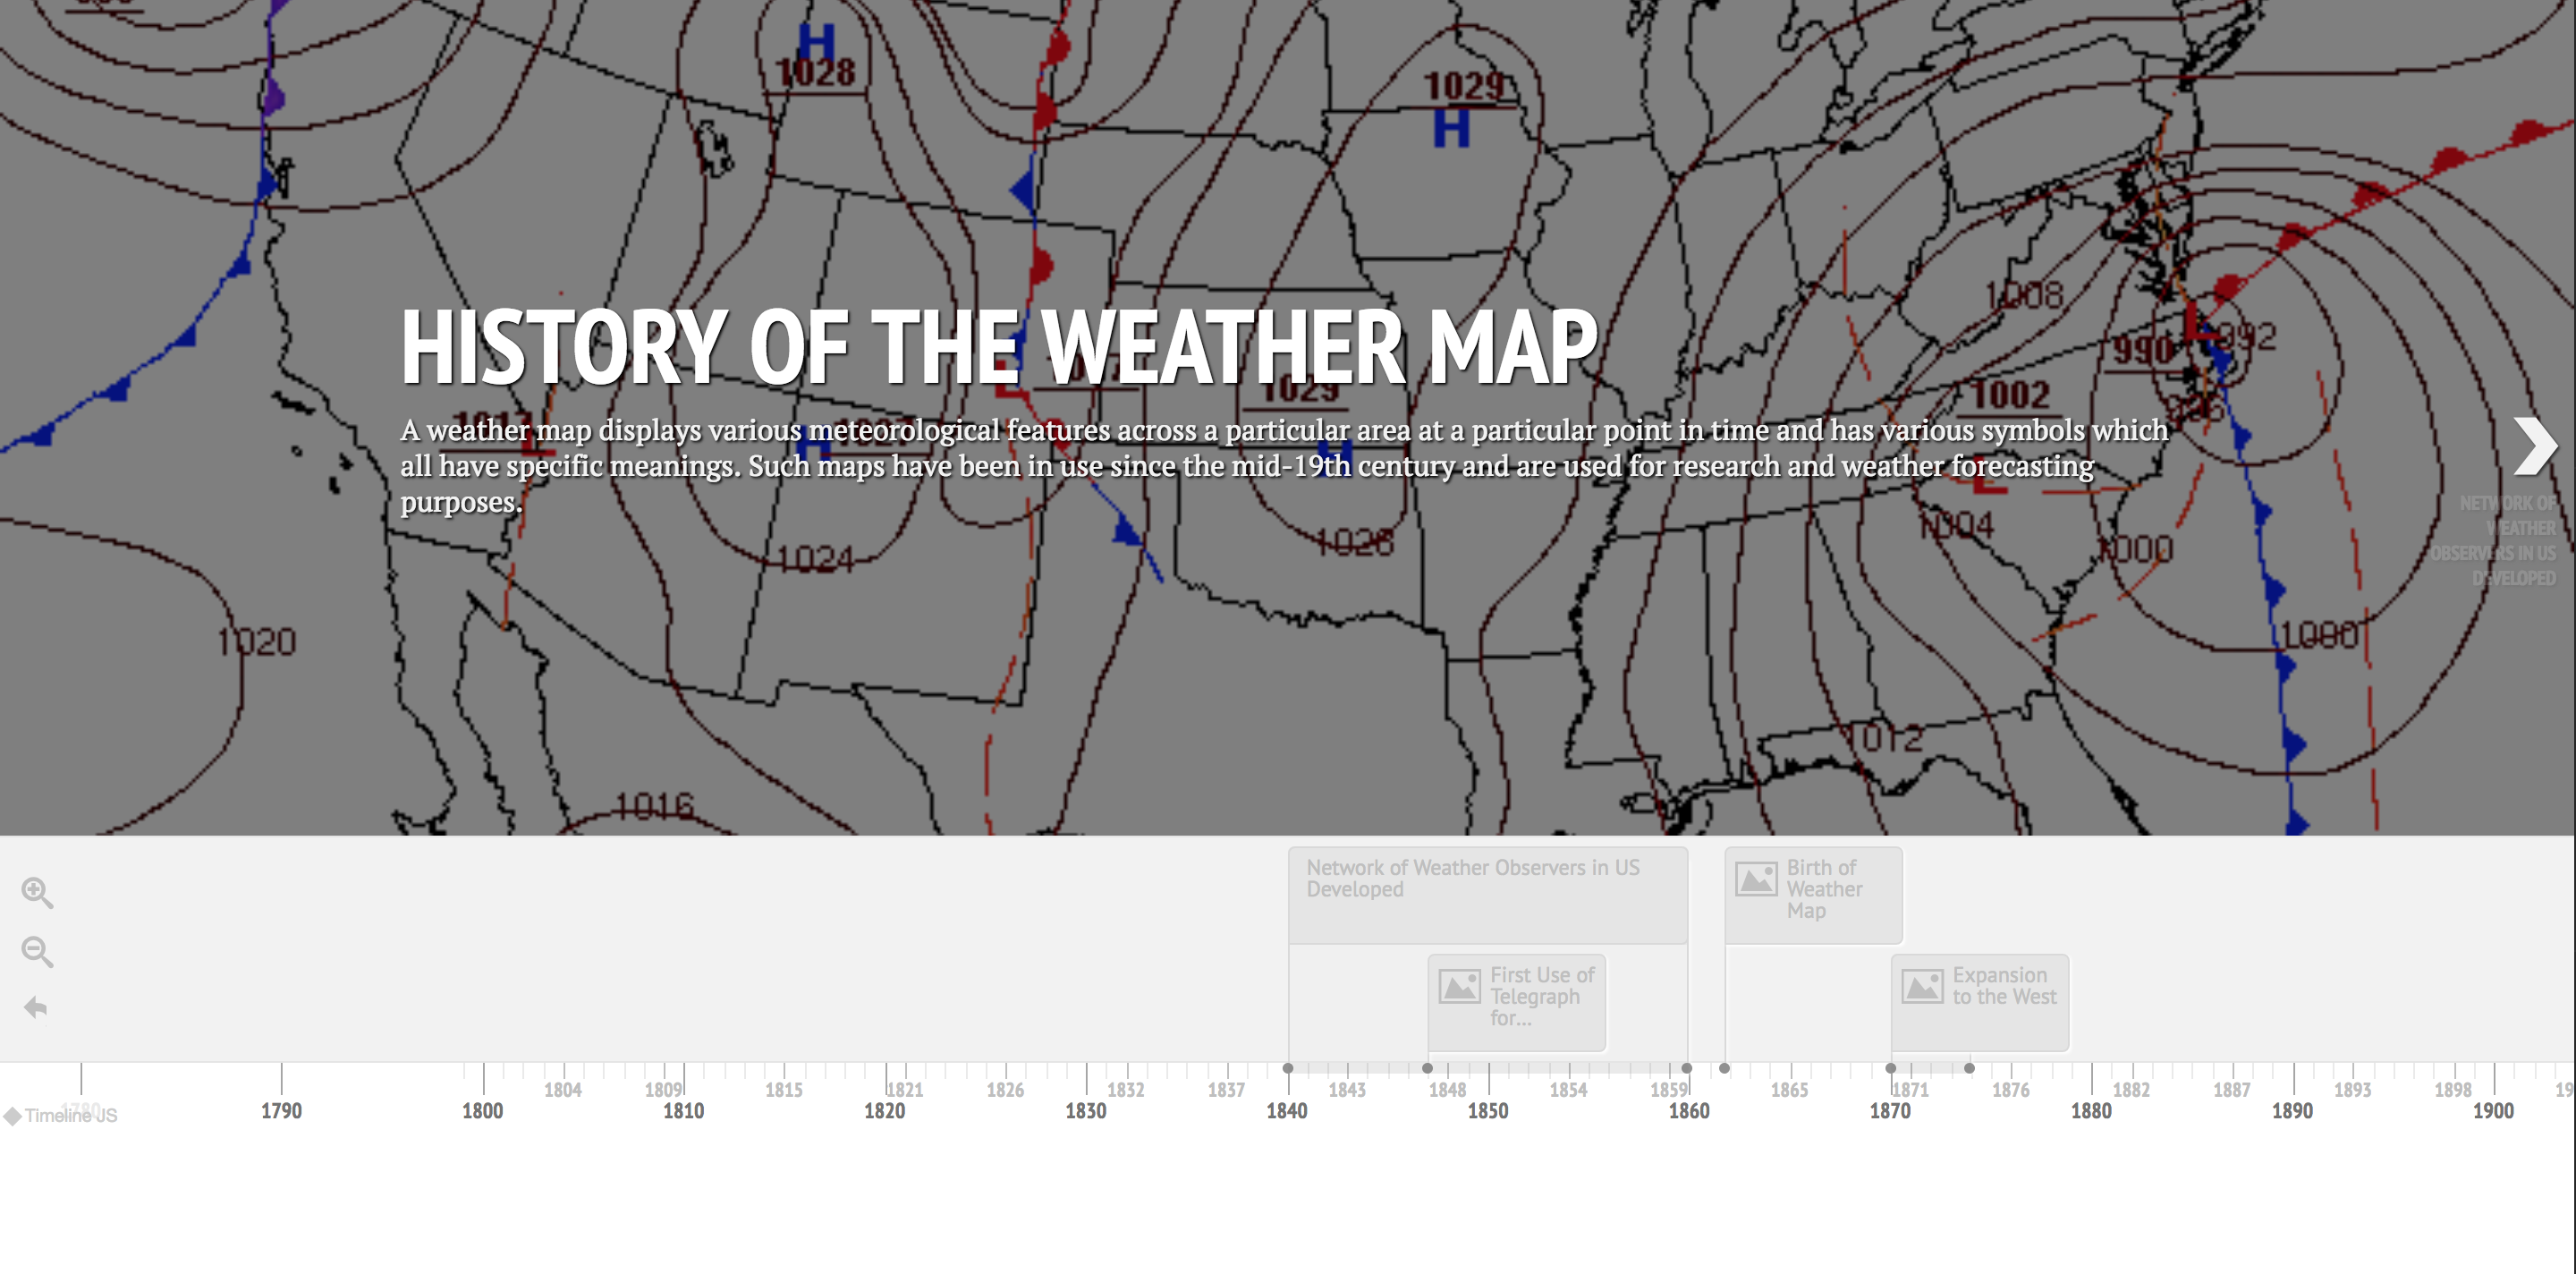
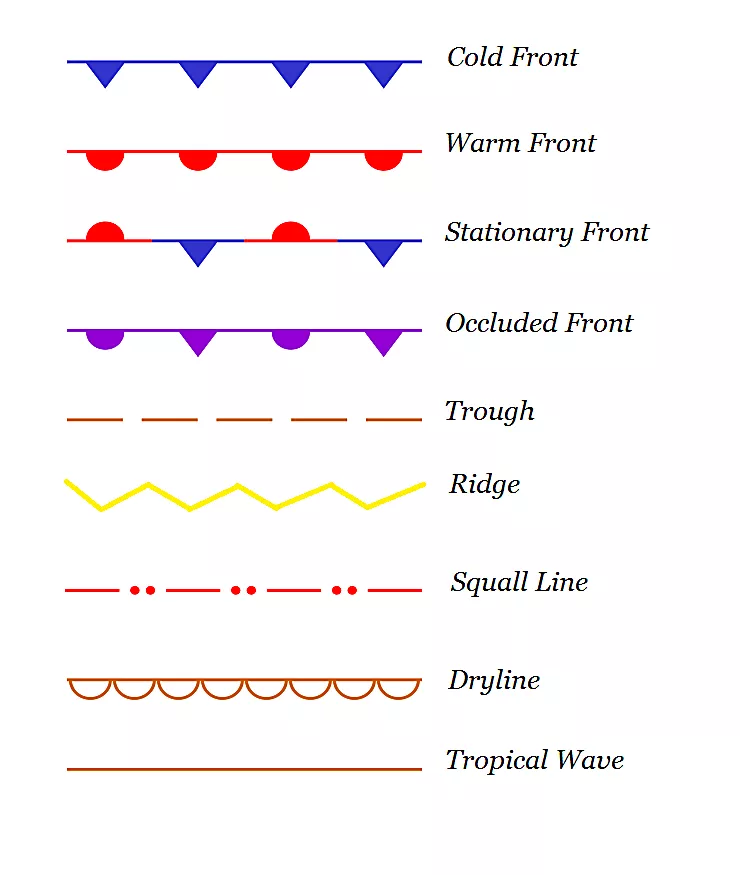
We frequently see maps on the weather section on the news channel. As someone grown up with instant access to today’s forecast, I never took the time to understand what all the lines and colors meant in the forecast maps. In researching the history of weather maps, I saw that the indications on the map not only gives us the weather predictions for the day but there was so much more information we often bypass. In a map like below, we can understand and predict possible behavior of the weather for the upcoming days, wind direction, ocean currents, visibility, cloud cover, atmospheric pressure, and more.
 Maps have not always looked like this. From looking into the history, maps didn’t exist and people faced disasters being caught in a storm. The history of the weather maps touch base on the journey it took to become what it is today.
Materials
- TimelineJS: Open-source tool used to build the interactive timeline.
- Google Spreadsheet: Online cloud spreadsheet used to create and edit information and transform into the timeline
- Wikipedia: Online encyclopedia used for research for the timeline
- Google Images: Online resource to find images for the timeline
- References:
Methods
First, research was done to learn and collect information on the history of weather maps. When digging into the history of weather maps, the search went further down into history of the Crimean War to an English scientist to times zones and more.
With the data collected, the Google Spreadsheets linked to TimelineJS was filled out. Dates and information were placed in designated places so that when TimlineJS was previewed, the information will properly show in chronological order.
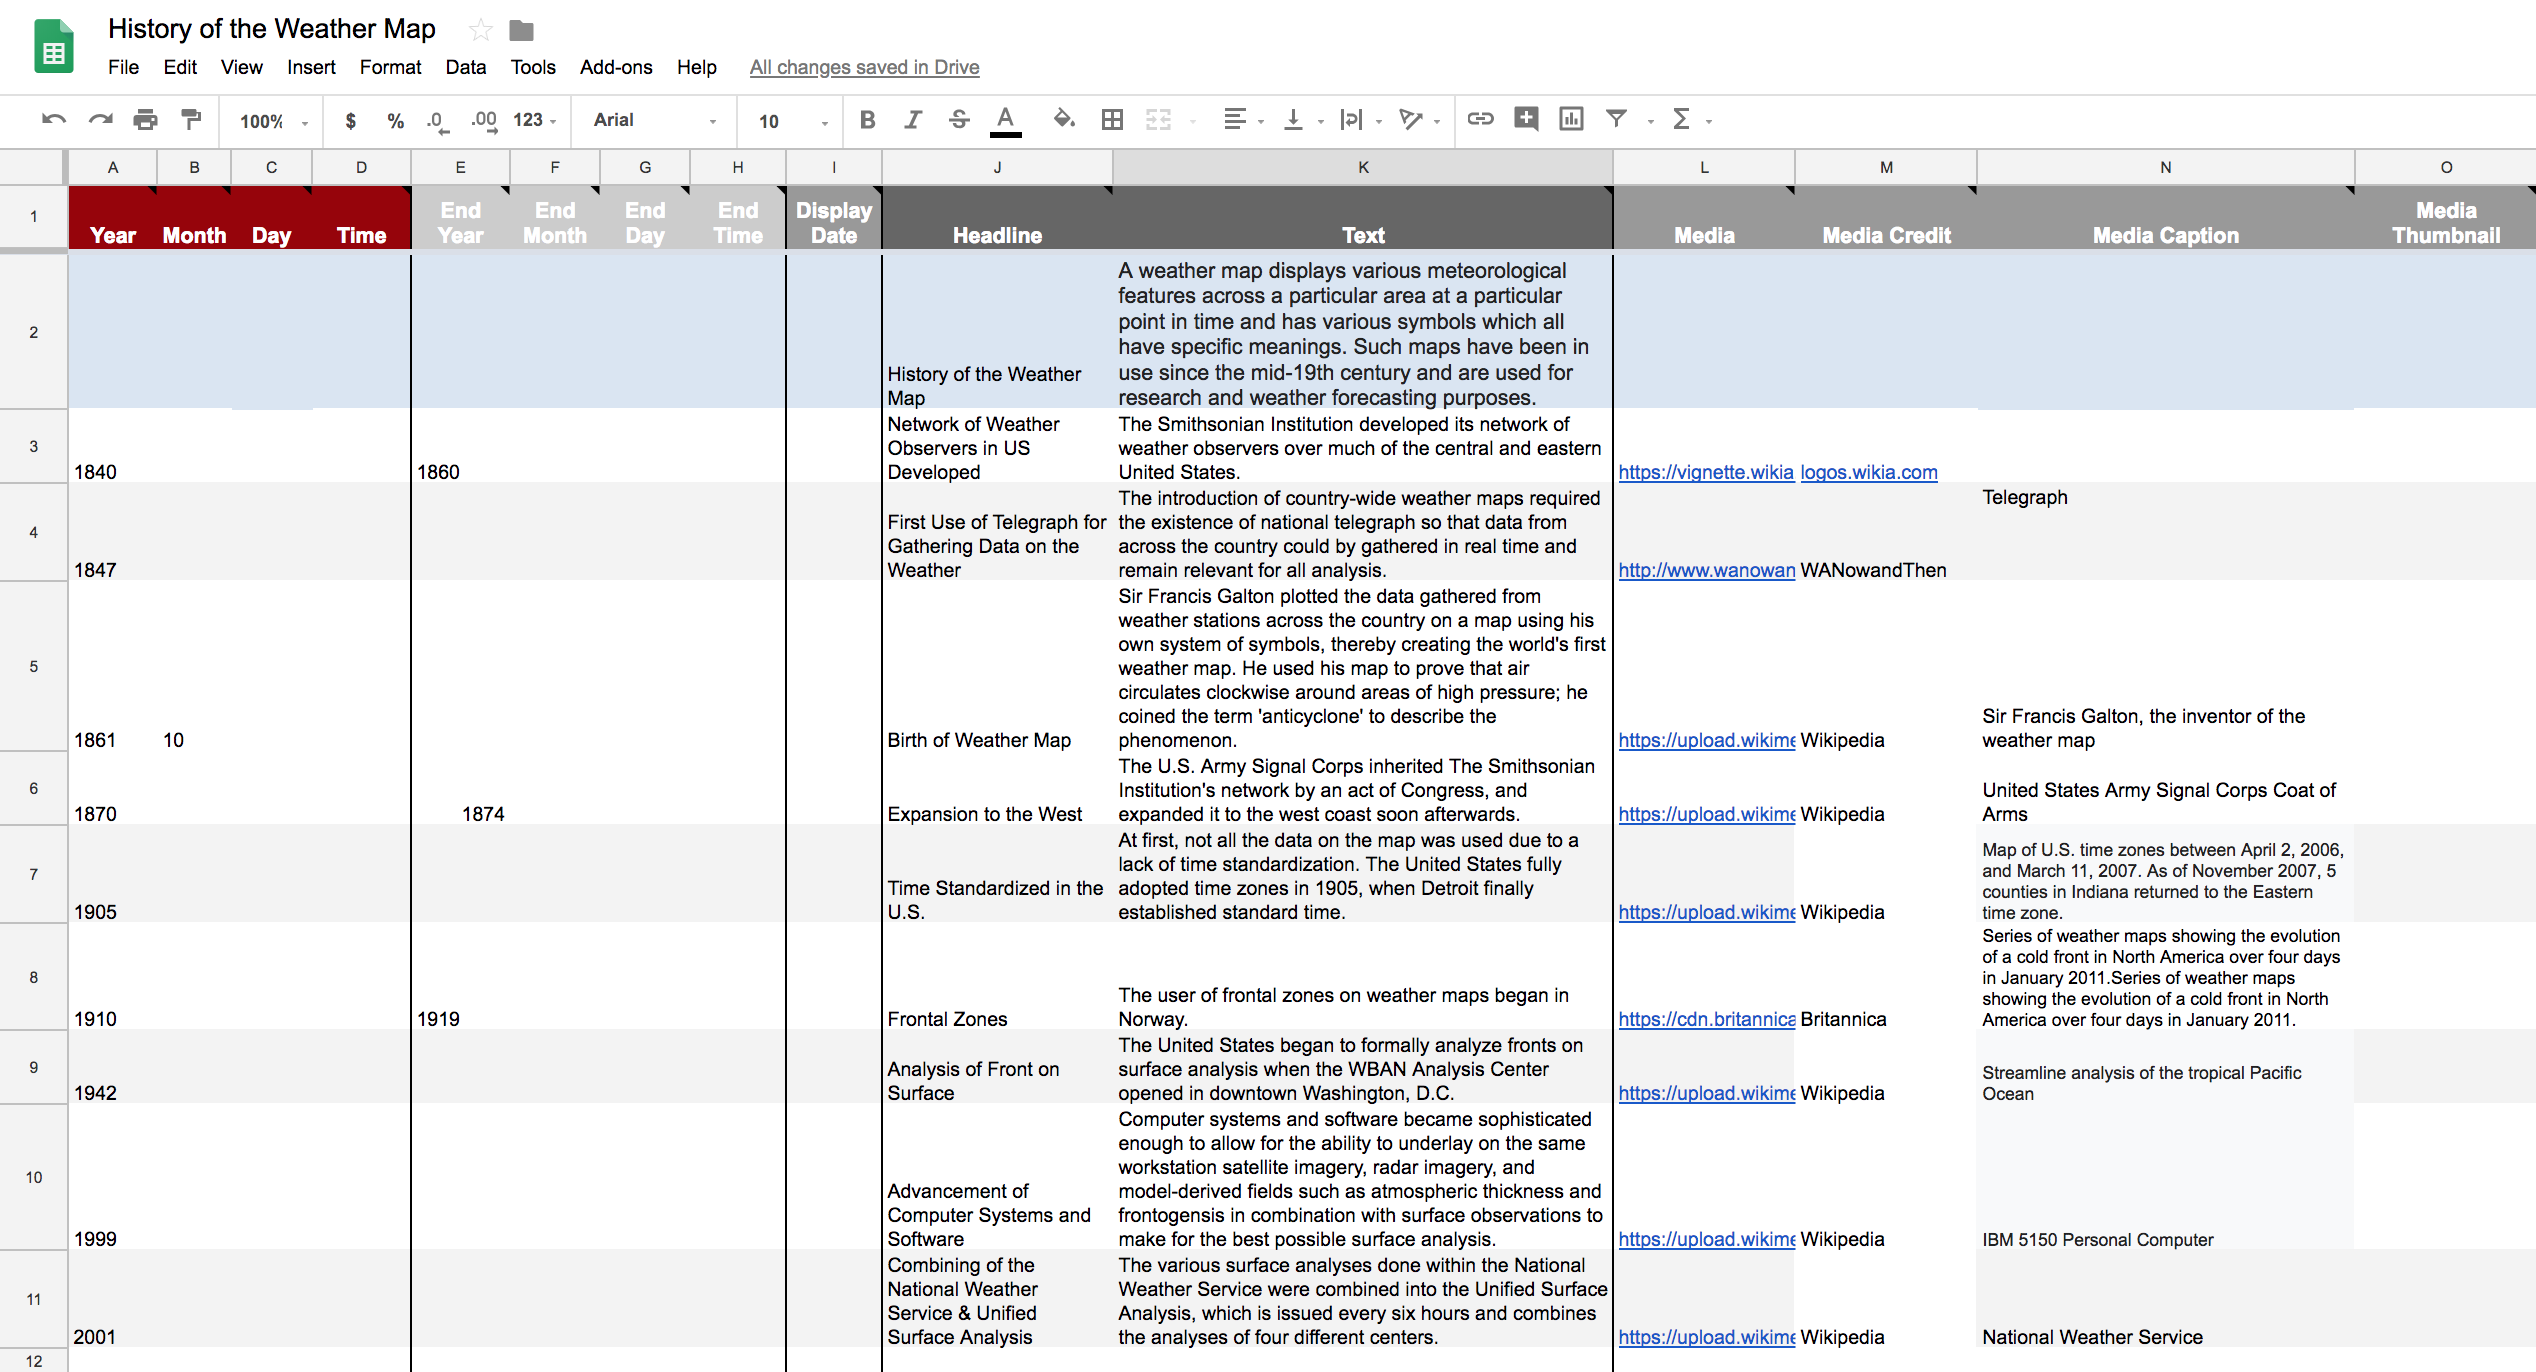
Once the information was inserted and published to web on the Google Spreadsheet, the link to the sheet was plugged into TimelineJS to view a preview of the timeline.
Results & Interpretation
History of the Weather Map Timeline
History of the Weather Map Google Spreadsheet
This timeline is high level of the history of the weather map. This timeline touches upon tips deeper history and advancements. There is potential for the timeline to grow and connect beyond the advancements of weather charts and maps and go into science, history, and technology of the world.
Reflection & Future Direction
As I was researching into the history, I came to realize that a thoroughly depiction of how weather maps came to be cannot be done with 10 events. I saw how many different countries, historical events, and technological advancements the weather map encountered to become what it is today.
I began this lab with a goal to understand the history of the weather map. However, digging into the history, I see that I’ve only hit the tip of the iceberg and will need to do a more in depth dive into the history in order to full grasp the science and technology behind how weather maps can be drawn out and recorded.
In the future, I would like to go deeper with this project and I will continue to incorporate more events into the timeline to branch out into all the parts that influenced and impacted the science, history, technology, and art of weather maps.
The post History of Weather Map appeared first on Information Visualization.