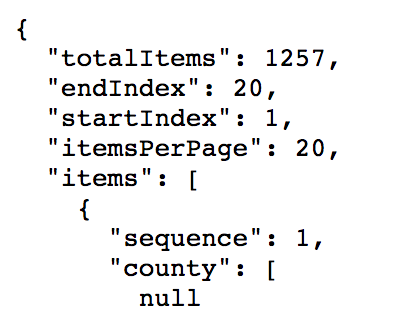
Heard about APIs, but still not really sure what they are or how to use them? This post will take you through: the basics of what an API is when you might want to use one what kinds of institutions or collections might have APIs of potential interest to DH practitioners where to look on these sites for access to…
Category: Skillshare Tutorials
Skillshare: Approach and Introduction to Python
[iframe src=”https://www.youtube.com/embed/smfueXrOHhY” width=”560″ height=”315″] The video above serves as a personable introduction to the coding language python which will be elaborated on below. This serves and a basic introduction to python, the coding language. Python is a great source tool for the someone not specifically code-literate to analyze data. It works especially well with many file formats which you…
Skillshare: .CSV to MySQL database
[vimeo 195745074 w=640 h=400] .CSV to MySQL import from John on Vimeo. Link to GitHub Repository This video demonstrates the process of formatting a .csv file, with data in it, for proper insert into a MySql database. The tools needed to carry out this process ars: A free copy of libreoffice (we will be using “Calc”). A free copy of…
Visualizing Poetry: Multivariate Data Analysis with Poem Viewer
[vimeo 195401136 w=640 h=360] Introduction to Poem Viewer Poem Viewer was developed by a multidisciplinary team of computer scientist, linguist, poets, and literary scholars at the University of Oxford and the University of Utah under the Digging into Data Challenge. It is an in browser tool that supports close reading through multivariate data analysis. Users are able to visualize, interact…
Introduction to OpenRefine
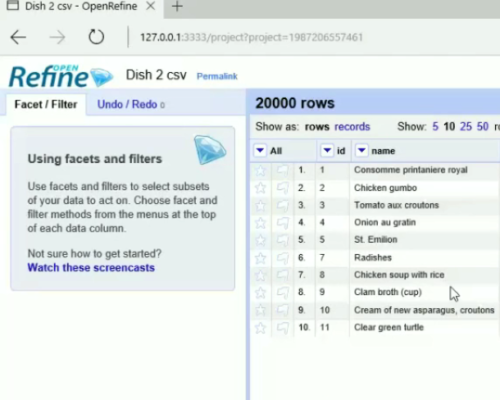
This tutorial (recorded using SnagIt) is intended to introduce users to OpenRefine, its basic features, and to act as a springboard for a digital humanities project/study that involves great quantities of data. The dataset used in this Skillshare was generated from New York Public Library’s (NYPL’s) crowdsourcing project What’s on the Menu?, where members of the public transcribed menu items from the 1840s to the present. Cleaning datasets is often the first step that needs to be taken when using public datasets, as they are typically messy, and OpenRefine can help users accomplish large-scale data cleaning (and data manipulation).
Overall, this Skillshare intends to introduce users to basic features of OpenRefine in order to make datasets more discernable (particularly for digital humanists who often use public humanities datasets), readying them for further analysis.
Mapping Visualization Tools: Tableau and/or Google My Maps
Click Image above to watch! Enable Closed Captions to view shared links This mapping skill share tutorial aims to: Introduce beginner/intermediate level users to two mapping visualization tools Compare the visualizations created from Tableau and Google My Maps Explain the tool selection process The Circus Historical Society’s vast collection of circus route data has been on my mind for…
Markdown/Pandoc Skillshare
Important links:
Markdown
Pandoc (Github)
LaTeX installer (for converting plain text to PDF)
This video tutorial provides a brief introduction to Markdown and Pandoc. Used in concert, these tools can help authors produce a variety logically formatted containers for content from plain text files. The tutorial will focus on the basics and benefits of Markdown syntax and execute a few useful file format conversions using Pandoc command prompts.
Back in 2004, John Gruber released Markdown on his website as a text-to-HTML conversion tool. The goal was and is to allow for the implementation of a set of simple, human-readable notations within a body of text that indicate the structure of the text (e.g. which part is a paragraph, which part is a block-quote, etc.). These notations can then be parsed by a software conversion tool to create HTML containers that save the author the tedium of writing out HTML in order to cohere their document to a web environment.
Increasingly, researchers across academic disciplines have advocated for the use of plain text formatting as a means of taking control of both document preservation and transmission. The primary benefit of using plain text is that it separates text from typesetting, which have become entwined in personal computing with mixed results. Commercial word processors like Microsoft Word offer intricate typesetting features to manage the visual impact of bodies of text. These enable a plethora of presentation options, but the effects that these settings have on characters committed to a blank document are not always clear. Even the simplest Word template for composition involves some program-centric encoding that make the behavior of the text unpredictable if transferred to a different format. Basically, what you see is not what you get.
What’s more, while proprietary-ish formats like .docx or .pdf have become more open in the last few years, they require expensive software to access full feature sets and translate and convert documents. In the event that they cease to be promoted by their originating companies, these formats may become more difficult to open and edit as the market for business-centered document solutions rolls along. Plain text by its very nature is open standard and future-proof.
The basic principle at work with Markdown, making semantic relationships within the text both explicit and human-readable, makes it versatile. Markdown’s extensibility makes it an important tool to digital humanities researchers, who often publish work across multiple formats both in print and online. Its basic syntax distills the essential elements in a body of writing, those that will be significant to the author’s meaning in both a journal article and a blog post. Being able to conceptualize one’s writing as independent from the many visual forms it can take is a huge advantage in a discipline that fosters collaboration and remixing of ideas.
Markdown becomes more versatile in the constellation of conversion tools encompassed by Pandoc. Pandoc’s default approach to parsing the Markdown convention at use in a document is geared for academic formatting. This means that footnotes and citations, the primary methods by which knowledge is built and networked within scholarly publications, can be liberated from the elaborate apparatus through which word processors format them. Incorporating Markdown and Pandoc in a project workflow does not require extensive coding know-how, which makes doing so less likely to be disruptive for general users. The tutorial should be approached as a starting point for using Markdown in conjunction with other forms of text creation, and as a bridge to the more advanced tasks that can be tackled with Markdown and Pandoc.
Further reading:
Annie Lin and Ken Sherwood, “Markdown Not Markup – Easy Everyday Workflow for the Web”
Dennis Tenen and Grant Wythoff, “Sustainable Authorship in Plain Text using Pandoc and Markdown”
W. Caleb McDaniel, “Why (and How) I Wrote My Academic Book in Plain Text”
Chris Forster, “About 1400 Words of Skepticism about Markdown and an Imagined Alternative”
Omeka/Neatline Skillshare
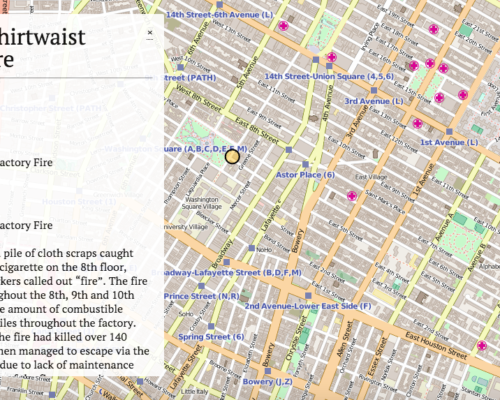
[youtube http://www.youtube.com/watch?v=n8tNkbEBQ5U&w=420&h=315] This instructional video details how a novice humanist can set up Omeka and Neatline locally.* Below are the links you will need to set up: MAMP ImageMagick Omeka Neatline What is Omeka and Neatline? Omeka is an open-source web-publishing software, which is often used by digital humanists to create and build digital exhibitions and collections with various types of media.…
VOYANT
The instructional resource of Voyant – Part 1 teaches beginners an important technology skill by clarifying the basic concepts underlying the default interface, and by providing a list of supplemental tools that may be added to the the default interface. A series of text analysis questions and Bloom’s Taxonomy may be applied for a specific learning purpose in Voyant – Part 2 and Voyant – Part 3.
Using Voyant for text frequency analysis
Voyant is a free textual analysis tool that can be found online at voyant-tools.org. This instructional post describes how to use Voyant to do text frequency analysis. This includes using tools that Voyant offers as well as exporting data and analyzing it on a spreadsheet. The video also mentions the other capabilities that the website offers, and demonstrates where different elements can be found on the page. I used a recent project of my own to illustrate each step of the process.