Event NYC Data School: Can open contracting hold smart cities accountable?

The panelists (from left): Greg Jordan-Detamore (Sunlight Foundation), Katya Abazajian, (Sunlight Foundation), Paul Rothman, (NYC Mayor’s Office), Zack Brisson (Reboot)

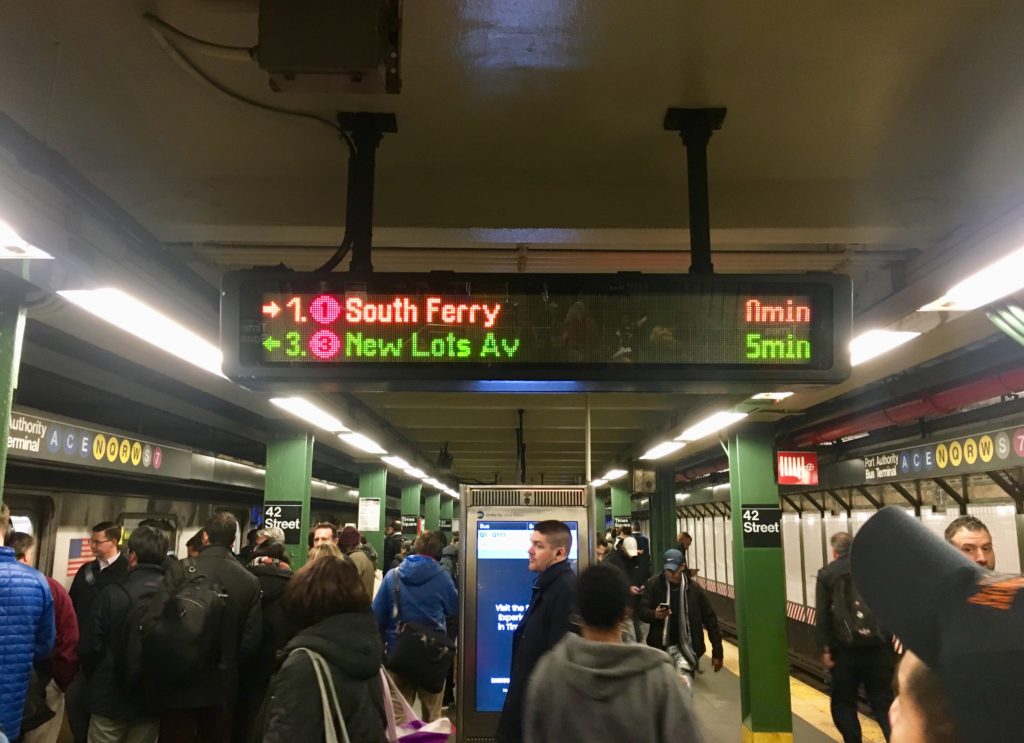
On a Saturday in March during NYC’s Open Data Week, NYC School of Data hosted their annual community conference to “demystify the policies and practices around civic data, technology, and service design.” With my BA in Geography, experience as an AmeriCorps VISTA, and current status as a Pratt IXD student, it’s not surprising I found myself drawn to a session entitled, “Can open contracting hold smart-cities accountable?”

On the 7th anniversary of NYC passing the Open Data Law, the hour-long discussion brought together 4 panelists: Zack Brisson, Principal at Reboot; Katya Abazajian, Open Cities Director at Sunlight Foundation;  Paul Rothman, Senior Product Manager at NYC Mayor’s Office of the Chief Technology Officer and Greg Jordan-Detamore at the Sunlight Foundation.

I’ll reflect on the event in hopes to continue the conversation on transparency and accountability in government tech, particularly smart-city technologies, amidst the rising tide of surveillance capitalism.

via Vecteezy

Who builds smart cities?

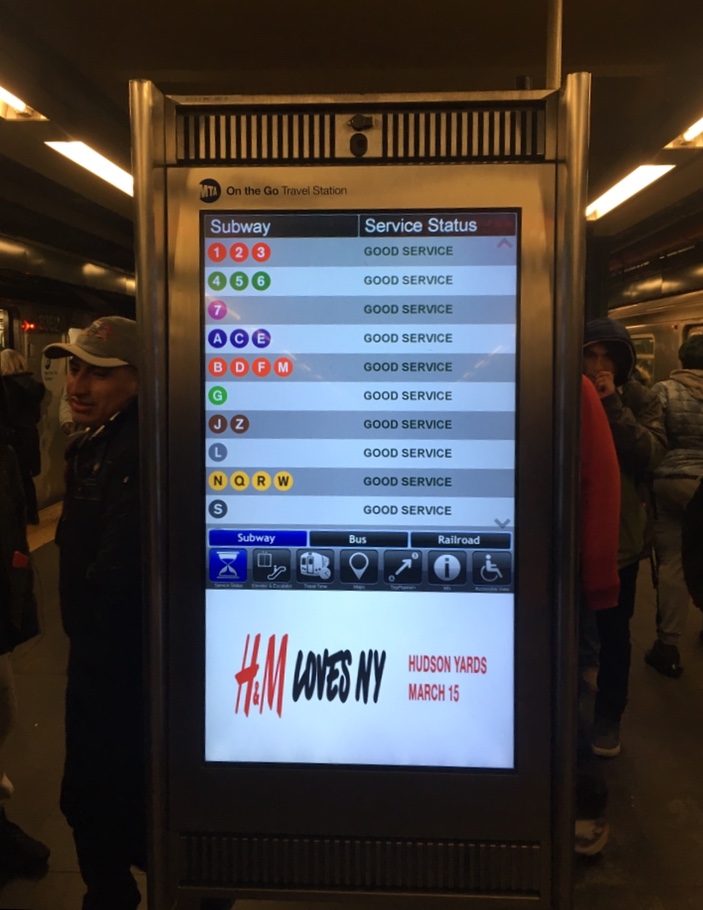
Upon opening the panel, Mr. Jordan-Detamore of Sunlight Foundation explained regulating, or even discussing the regulation of, smart-cities is difficult because the term is a broad buzzword with no real definition. For the purpose of the discussion, the panelists clarified their meaning of smart-cities as “urban centers being used to collect data and then things being done with that data for some purpose.” Admittedly still pretty broad, but somewhere to start!

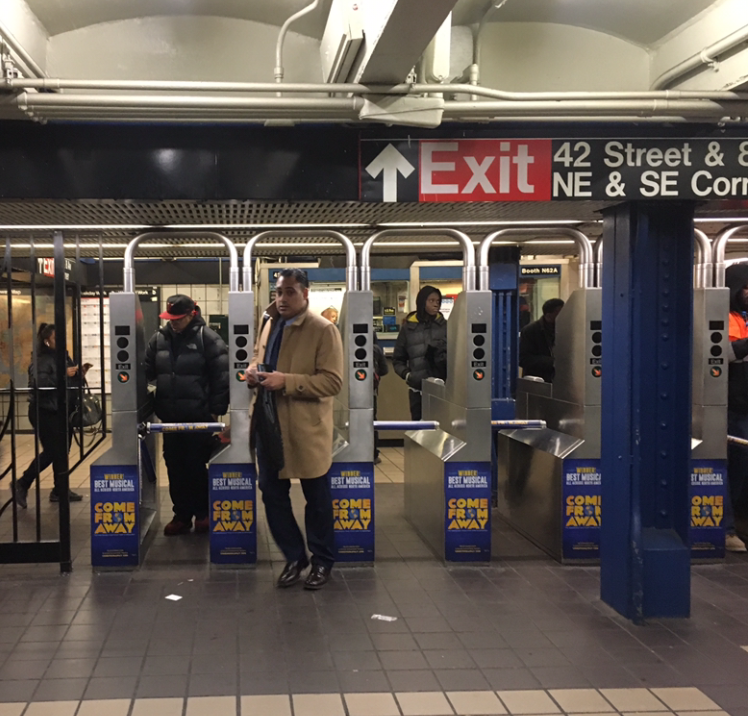
The panel really focused on the relationship between those who make the actual technology, and the governments who purchase them. Smart city technologies are built by private technology corporations, or vendors, like Google, but once the city begins using them, it’s often unclear who owns the resulting data. The speakers explained the reason cities purchase technology from private corporations is pretty obvious: Governments often lack the organizational infrastructure and internal expertise to build on their own (remember Seattle’s failed independent bike-share). One panelist asked, “I mean, how great would it be if your city’s government was as efficient as Amazon?”

The government-vendor relationship

Early on, the panelists underscored the imbalanced relationship between the government and corporate entities who enter into smart city technology contracts. Governments looking to procure a product “never really have the upper hand,” explained Abazajian from the Sunlight Foundation, as they don’t have the same technological expertise. The Sunlight Foundation’s Jordan-Detamore stressed that governments, especially smaller municipalities without the infrastructure of, say a Boston, are especially vulnerable of being swindled by the shininess of Silicon Valley.

While watching an episode of VICE News Tonight a week after the panel, I saw the disastrous potential of manipulative contracting in the town of Jackson, Mississippi. The manufacturing conglomerate Siemens sold 65,000 water “smart meters” to the city for $90 million dollars in 2013. Fast forward to 2019: the water meters don’t actually work and started a billing crisis that has grown into the city’s $25 million debt. About the dynamic between the city and Siemens, Jackson Mayor Chokwe Lumumba told VICE News, “It’s akin to someone selling you the most expensive car that they have on the lot, and understanding at the time that they’re selling it to you that you can’t afford to buy it; you don’t understand how to operate it, but if they can get you to purchase it, they will.”

Via piktochart

Behind closed contracts

There’s a lot of cloudiness around the ethics of smart city technologies because their contracts are, more often than not, closed. Closed contracts that limit the details to the public are the norm, and tech companies want to keep it that way. Before this panel, I (slightly embarrassingly) had no idea there was even an option of opening them.

Abazajian explains, “vendors make the argument their proprietary technologies warrant a closed contract, but in reality, they don’t need to be.” There’s a broad range of contract data that’s not sensitive, not private, and not proprietary. Lack of transparency in contracts was unanimously cited as a major issue in protecting civil liberties by the panelists.

Would an open contract have saved Jackson, Mississippi? Via CC.

Advocating for open contracts

The panelists from the Sunlight Foundation explained their new open contract initiative, which helps city governments open the process of procuring smart city technologies. On a functional level, opening a contract means giving the public access to smart-city contract data in a standardized way, so advocates and other community members can see how public money is spent.

Sunlight Foundation operates under the notion that the public should be involved in the rollout of smart city technologies from the start because they are the major stakeholders. A vendor should not be able to come in and “trample the public’s right to information,” one panelist quickly quipped. “Open contracting creates feedback loops”, explains Brisson, which “helps infuse community input into the plan.”

While watching the segment on Jackson’s water bill crisis, I couldn’t stop wondering what would have happened if the contract was public to begin with. Public outcry could have halted the overly ambitious and exploitative plan that sunk the small town into massive debt.

References:

A $90 million “smart” system has totally screwed up these residents’ water bills – VICE News. (n.d.). Retrieved March 21, 2019, from https://news.vice.com/en_us/article/vbw8qy/a-dollar90-million-smart-system-has-totally-screwed-up-these-residents-water-bills

Naughton, J. (2019, January 20). “The goal is to automate us”: welcome to the age of surveillance capitalism. The Observer. Retrieved from https://www.theguardian.com/technology/2019/jan/20/shoshana-zuboff-age-of-surveillance-capitalism-google-facebook

There Is No Such Thing as a Smart City – The Atlantic. (n.d.). Retrieved March 21, 2019, from https://www.theatlantic.com/technology/archive/2018/02/stupid-cities/553052/

Why good policies go wrong: Seattle’s botched bikeshare model | Apolitical. (n.d.). Retrieved March 21, 2019, from https://apolitical.co/solution_article/good-policies-go-wrong-seattles-botched-bikeshare-model/

Event: Data Through Design

I attended an event at the NEWLAB called Data Through Design, which was split in three separate sections, an exhibit viewing, artists discussion, and panel discussion. This event was an independently organized exhibition for data and cartography where they introduced a few artists who have used data in their projects and a panel discussion based on proxies was discussed. I’ve participated in the entire event and gained a lot of knowledge from the events discussion based on what the artists and panelists said throughout the event. This event was a high interest to me because I wanted to gain much more understanding in data collection from online data websites and how it can be used for a design project. I have taken a data visualization course in programming on my undergraduate years and have knowledge in collecting data but I wanted to learn more. Back when I took my data visualization course, I was very amazed in how data sets can be used in a program to determine a solution and get information. Even though I have knowledge in data collection this event caught most of my attention because of its panelist discussion in everything is a proxy. The panel was a discussion about proxies in data models where they are used in the complexity of getting a specific data set that works best for your project or needs. Proxies is everything is their theme in the discussion and this is because proxies are the information of things around us that can be brought together in order to be used in special work for the society. In my understanding the event is teaching the audience to grasp knowledge on data and how data is useful to the people and their works.

At the event I saw an exhibition viewing. In the exhibition there were a couple of projects created by the artists who were in speaking at the event. There was piece of works called temporal views of a bike lane, collision course, cards against hate, and a few more. All of these exhibits have data collection in them that was used to be created. For example, one of the exhibits called cards against hate showed cards that had different information about none hate crime in the week based on religion, race, and other subjects. The artists who created these cards used a data collection to get the information they needed to showcase their work. The artists who created this piece of work spoke to the audience and said that the data sets they used helped them get what they wanted and they agreed that the data collection of information would change the society in many ways.

The event talked about how useful data is helpful to the people and the design projects that are being developed by artists. Data is a big informational source that never ends. You can use data for anything you want. But mostly people use it to find solutions, make life simple for its users, and create a better living for the society. The information within data is very big and you can find about anything on the topic you choose to explore on. I believe that the information within data is useful in many ways and will help the people or users interact with products that use data in a much effective way. There is still a lot more information to be added to data. It is a growing branch that has no limits. Data is big and is growing more and more every day.

Proxies or data collection is a good tool because it helps users connect with information in a faster and smarter way. As Jim Martin and Raik Zaghloul say,

Collection management is profoundly affected by rapid changes in the library profession. While this provides librarians with opportunities to connect users with information, it also demands the ongoing development of new skills (Martin & Zaghloul, p. 313).

Even though I have knowledge in data collection, I have learned a lot by going to this event. This event should go on more throughout the years as technology is developing every day. The event has given me the understanding of how data or proxies is a big solution to the society. I believe that the event changed the way I see data in the way that data not only has been used at libraries, programs, but also on design works like cards against hate. Many of the words spoken about data at the event gave me the expertise on how data collection is used in about almost everything that we can think of.

Reference

Jim, M. and Raik, Z. (2011). Planning for the acquisition of information recourses management core competencies. New Library World, 112(7/8), 313-320. Retrieved from URL https:// doi.org/10.1108/03074801111150440

Link to event: http://2019.datathroughdesign.com/

Observation of Future of Physical Retail

When considering the kind of information environment, I wanted to observe, I wanted to observe the evolution of physical retail experience. I chose this because retail environment is experiencing a lot of changes after the emergence of e-commerce. Ground breaking retailers are seeing an incentive in looking priceless and administration to make a vivid shopping knowledge intended to pull at heartstrings and catch client dedication, notwithstanding for a brief timeframe. Developing innovation makes it less demanding to mix the physical and advanced retail understanding to give better knowledge into client conduct and expectation — and make a really special vivid experience for their clients. Retailers can utilize this total picture to make an increasingly customized shopping knowledge, drive transformations, improve client administration, and set themselves apart from their opposition. 

 I decided to go to the Nike Flagship store in Midtown on a weekday afternoon as it provides knowledge in a situation that is as responsive as digital.  This Six-story space is called as the “House of Innovation 0000”, a very first effort of Nike to bring retail to life. 

 While walking on the fifth avenue, the whole black building with frosted patterned glass panels and a huge Nike logo grabs my attention. The architecture itself gives information of from where the entrance is. The red glass door opens up to a sci-fi art installation of computers having heat maps and holographic shoes stating the identity of the brand. The store consisted of young visitors. The first floor is treated as innovative museum of Nike. It consisted of information of design process on screens and showing prototypes of previous shoe designs and the latest designs for sneakers. It also encouraged people to download its app to get the full experience of store. There was a digitally heat mapped sports court installed inside where people could experience their shoes before purchasing it. The tiles on the Arena can be reworked to have new spaces and designs; as the choice develops, the store format can advance as well, making the House of Innovation 000 an adjustable store in each feeling of the word. I think this was a really interesting feature because only in retail you can understand the feel of the shoes and nothing better than playing the game of choice in it to understand the comfort of it.  

I was directed to the second floor where there was Women’s clothing section. Here there were barcodes besides every product. People need to scan that barcode to purchase the product or get the desired size in the changing rooms. This helped people to roam around the store without carrying the weight of the cart. The whole process of shopping was digitized which made retail fun. Similar facilities were provided in the Men’s clothing section on the third floor. 

On the fourth floor was the shoes section. It had a sneaker bar and various designs in shoes. A full customization wing of Sneaker Bar, conveying on Nike’s spearheading DIY soul and offering an abundance of bands, textures, decals and more with which to adorn a wide determination of consistently invigorated footwear. People could customize the shoes themselves. The younger generation and shoe fanatic people were really enjoying it.  Even in this section there was a barcode besides the shoes which should be scanned using the Nike app to get it of size and choice. This barcode scanning is a really a great feature because then I need not search for a representative and wait for the whole process of finding a shoe of choice.  

This leads me to the last floor of the building where there is a Nike Expert Studio. This feature of one-on one joint collaboration with expert stylist can be booked by Nike members in-store and on the Nike App. I think this section was very VIP section where people could interact with stylist and get customized clothes or clothes that suits their body type or style. Very few people were coming to this section. I personally think this section was not getting as much attention as previous ones. They have not given much information about it even while entering the store. 

Observing this whole space was really interesting. It appeared that some visitors were there to only experience the innovative retail space. They were curious about the interactive features and the technology used in the store. Despite the unfamiliarity of technology some people were inherent on using it as someone would think they were stealing from the store. The young generations were very engaged with the technology. But the older generation was sticking to the conventional style of retail. 

As Bates stated in Fundamental Forms of Information, we will simply consider subjective experience, including the experience of remembering, to be the first on a list of kinds of embodied information that result from neural encoded information. I really enjoyed observing people first taking the experience of the product and having hands on customization which then lead them to buy the product. I observed what Marchionni said changes in the human–information interaction entities relate to learning or other mental state changes in the human and usage changes in the information object. I could sense the different between interaction with technology of different generation which depends on both urge of learning and mental state. 

I trusted it is the ideal convergence of individuals, innovation, and style in one space. The space had the capacity to speak with its city through individuals and advanced administrations, welcoming a discussion that is synchronized to the client.  From my perspective the whole technological process is overwhelming if you are trying it for the first time. But if this is the future of physical retail, people will get used to it eventually. Overall it was a great initiative taken by Nike Team. 

References: 

https://news.nike.com/news/nike-nyc-house-of-innovation-000

Marcia J. Bates Fundamental Forms of Information, Journal of the American Society for the Information Science and Technology, 57(8):1033–1045, 2006. 

G. Marchionini / Library & Information Science Research 30 (2008) 165–174. 

Richa Kulkarni, INFO 601-02

NYC Subway and Human Interaction

New York City’s Subway is one of the oldest and most efficient public transit systems that the world has seen. It started operating in the year 1904 and runs 24 hours on every day of the year. The Subway transit is also the most used metro system of the world, by a countless and diverse population. 

The Subway lines run through Manhattan and branch out into the boroughs of Brooklyn, Queens, and Bronx. It is a network of extensive structures and many junctions, of which I have made observation of one – Times Square 42nd Street/Port Authority Bus Terminal(PABT). 

This Subway station complex is located under PABT and Times Square at the intersection of 42nd Street, 7th and 8th avenues, and Broadway. Every train has a distinct color and number or alphabet associated with it. The 42nd Street Times Square station offers access to multiple lines. 

42ndTrainStation-trains

All the lines are bi-directional, running towards uptown and downtown. There are local lines which stop at every station, and there are express lines that make stops at fewer stations. Most lines, except a few, run 24 hours with higher frequency on weekdays.

NAVIGATION AND TECHNOLOGY 

The Subway system has a very well designed way-finding system which poses hardly any challenge to its users. It uses consistent visual language, universally accepted icons, and smart placement to make navigation through the enormous space easy. All signages are on non-reflective black surfaces with white legible sans serif text. The signages mark uptown and downtown trains with their specific icon. Use of icons and text together reinforces information, the “S” with “Shuttle” for instance. While the train icons are invariably placed on the right of the text, icons for ramps and wheelchairs go consistently on the left. 

A user’s initial point of contact with the Subway system’s technology is at the entrance where he finds a Metrocard vending machine. The machine accepts cash, debit or credit cards and is effortless with touch screen and comprehensible instructions. The system is quick and economical with $1 for the Metrocard itself, and preset values that the user can choose from to put charge on the card. Moving further the commuter enters the station through turnstiles which use a card reading technology. 

Metrocard-vending-machines

Throughout the Subway premises Customer Assistance Intercoms and Emergency Intercoms are easily accessible. The smart positioning of speakers allow system announcements to be audible all over, without any hindrance from the commotion. The station has Subway maps at frequent spots and Neighbourhood maps and entrances/exits. 

Maps-at-Subway-entrance-exit

Moreover, a recent addition of interactive touchscreens has augmented navigation. These all-in-one customer information devices allow one to select a destination station, in response to which the screens display possible routes with time estimates. Aside from information on train schedules these screens also offer recommendations for points of interest at select locations, information about escalators and elevators, outages and train delays, or if planned work is coming up. However, commuters don’t seem to use this technology as often. 

Interactive-screen-at-Subway-platform

All platforms have digital screens displaying ETA for their respective trains. 

Screen-displaying-trains-ETA
S

There are multiple apps designed specifically to aid Subway navigation, for example MTA Subway Time.

The 42nd Street Station, as all Subway stations, has several entry/exit points spanning across surrounding blocks with supplemental northwest, southwest, northeast and southeast corners, marked “NW”, “SW”, “NE” and “SE” respectively. There are two underground passageways to PABT allowing easy transfer to interstate buses.

CONVENIENCE AND EXPERIENCE

ATMs, convenience stores and trashcans are easy to locate. The subway is safe, and well monitored by surveillance cameras and police. Several posters advertising tv shows, web series and brands among other things, offer a sense of familiarity and make the experience less daunting. Also serving the same purpose are the artworks on the walls. Musical performances are a regular affair at the station, which also becomes a platform for artists to showcase and sell art. This makes the Subways less monotonous and more entertaining. Yellow strips at the edge of the platforms mark a safe distance from the rail tracks. These strips are embossed to prevent slipping. A set of benches are placed at the platforms for senior citizens and physically challenged.

Advertising-posters
Musical-performances
Artworks

An attempt to incorporate inclusive design has been made through the use of braille, ramps and elevators, but it fails to be efficient. 

inefficient-inclusive-design

ON THE TRAIN 

Every train’s icon, number/alphabet and route is visible on it. Red bulbs light up on both sides of the automatic doors when they are open. Many advertising posters on the insides of the trains offer comfort and interaction. There are poles and railings for standing commuters to hold onto. Newer trains have digital display of the trains route with current and next station highlighted, but the old trains only have a poster of the trains’ routes. To complement this, system announcements alert the passengers of the upcoming and current stations. There is priority seating for disabled and senior passengers. Clear instructions for events of emergency are displayed with assistance intercoms and emergency brakes.  

Posters-in-train

OBSTACLES AND SUGGESTIONS

The Subway system is extremely well planned and functional, and given its technological structure manned stations are barely needed. Although, a considerable number of users are not tech-savvy. There is a lost and found unit, but without relevant assistance chances of items being turned in are slim. There could be a dedicated station for a personnel within the premises for further help. Nonetheless, NYC Subway system is an exemplary public space design with minimum room for errors.

References:

Event Attendance: Designing the Connected City @ Cooper Hewitt, Smithsonian Design Museum

By: Michelle Kung
INFO 601-02 Assignment 3 Event Attendance

Cities like New York are notorious for congestion and pollution. It often takes the same amount of time to walk somewhere as it does to drive somewhere. But big tech companies are reimagining urban mobility with connected and autonomous vehicles (AVs). On the 25th of February, 2019, leaders in the field of autonomous vehicles or driverless cars came together at the Cooper Hewitt, Smithsonian Design Museum for a panel discussion. Moderated by Cynthia E Smith, the curator of Socially Responsible Design, the panel consisted of Sarah Williams, the director of Civic Data Design Lab at MIT, Ryan Powell, the head of user research and UX design at Waymo (Google’s self-driving car project), and Jack Robbins, the director of urban design at FXCollaborative. With diverse backgrounds, the three panellists debated topical issues engendered by AVs.

A World Unknown

One thing that the three panellists agreed on was that no one really knows how technology will impact mobility in urban spaces. The field is still new and concepts have only been tested on limited scales. Jack Robbins called this ‘a new era of mobility’. Indeed, we have no idea how the way we move, not just within cities but across the country, is going to change. All we know, and all leaders in the field know, is that autonomous vehicles will be the biggest drivers of change.

Heaven or Hell Scenario

Jack Robbins illustrated two opposing scenarios: a heaven scenario and a hell scenario. In the heaven scenario, after autonomous vehicles have replaced standard vehicles. There will be fewer vehicles on the road, fewer vehicle miles travelled and more spaces freed up in cities for other things. Without the need for parking (i.e. temporary storage of private vehicles) within the city, there is a tremendous opportunity for the creation of more green spaces and open spaces which will increase the liveability of any congested and densely populated city. On the other hand, in the hell scenario, there will be more vehicles and more vehicle miles travelled. Autonomous vehicles will be on the road driving around with or without passengers, which would be terrible for inhabitants of cities as well as the health of the planet. 

Will companies deliver on their promises?

Companies developing autonomous vehicles are of course promising everything detailed in the heaven scenario. But Jack Robbins cautioned event goers against trusting these companies too much.  After all, the way they make their money is incompatible with the promises they are making. For example, Google sells advertising but is promising increased road safety, mobility equity, easy parking, transit support, and less traffic. But how? By gathering an increasing variety of information on humans and on built environments.

Human Behaviour is Information as Thing

Waymo, Google’s driverless car company, purports to take a human centred approach to create a ride hailing service. Their primary goal is physical safety. In order to achieve this, Waymo collects an incredible amount of data on people and human behaviour in order to program the world’s most experienced drivers. According to Ryan Powell, 94% of road accidents are caused by human errors and Waymo’s aim is to eliminate this altogether. Waymo has managed to collect the data of behaviour patterns of adults, children, and cyclists in order to teach their fleet of driverless cars how to react safely in each scenario.

On the surface, treating human behaviour as information as thing is not at all revolutionary. Psychology, anthropology, and a whole host of other social sciences have studied the behaviour of humans for decades. But the monetisation and capitalisation of this information on such a large scale is new. Speakers in this talk were more interested in talking about the information regarding the space and infrastructure of a city than information about the people living in them, which is slightly alarming.

Public Space as Private information

A huge topic of debate in this design talk was the importance of the public nature of public space. Speakers Sarah Williams and Jack Robbins both challenged Ryan Powell on Waymo’s current practices of keeping information about the public space private.

As Waymo gathers more and more information on public spaces, their data set becomes more valuable. Sarah Williams advocated for city governments to leverage their power to ban companies like Waymo from operating in their cities to negotiate data rights. Both Sarah Williams and Jack Robbins argued for the importance of public governing bodies to step up and play a more active role in this sphere rather than passively hoping for technology companies to do the right thing by citizens. Autonomous vehicles pose real dangers in deepening and widening the digital divide, privatising public data, and decreasing equitability in cities. It is up to cities to set boundaries, guidelines, and regulations so that data collection and ownership of cities contribute to the public good and can benefit the many rather than the few.

Conclusion and Reflection

This design talk was fascinating and helped me conceptualise the new forms of information this emergent technology creates. The panel discussion really encouraged me to think more deeply about the data rights of citizens and city governments. It is already inconceivable, the amount of data big software companies have on our digital behaviour. It is entirely unimaginable, for the average user, what information companies developing autonomous vehicles will have on our behaviour in physical environments once AVs become more mainstream.

In the meantime, it is clear that city governments need to catch up to big tech players in order to ensure that public spaces are protected, new infrastructure built is adaptable to unforeseeable changes, that cities become more liveable in the long term for all its inhabitants, not just a select few.

References

Buckland, Michael K. “Information as Thing.” Journal of the American Society for Information Science42, no. 5 (1991): 351-60. doi:10.1002/(sici)1097-4571(199106)42:53.0.co;2-3.

Observation: Museum of Modern Art

Introduction:

The Museum of Modern Art (MoMA) is located in Manhattan, NYC. MoMA exhibits modern and contemporary art, including architecture, painting, sculpture and new art forms integrated with technology. MoMA is a world-famous museum, attracting a large number of visitors every day, which makes the process of information dissemination and acquisition particularly important. People acquire information in different ways, including taking photos, listening to commentaries, reading instructions and etc. Museums disseminate information through electronic display boards, text instructions, and broadcasting devices.

I went to the MoMA in the afternoon on March 19. In the lobby of the museum, it was not that crowded. Most people walked in twos and threes. Some of them were reading the introductions next to the sculptures, some of them were taking photos, and others were talking about the sculptures (figure 1). When I walked towards the stairs, I saw the sign on the wall which guided the visitors to the exhibition hall they wanted to visit.

Figure 1

Figure 2

After I climbed to the second floor, I saw an information desk. The lady who was sitting behind the desk gave me a map which showed the floor plans of the museum. On the desk, I noticed several different colors on the covers of the brochures (figure 2) and one color corresponded to one particular language that the brochure was written in. The brochures were a really cool design that let people from all over the world feel the warmth and respect in this museum. As I continued walking, I noticed that the free audio commentaries were a great design as well. The visitors can borrow free audio devices from the desk and use them to play the commentaries while walking in the gallery. The commentaries are translated into nine languages so that the majority of the visitors can find their preferred one (figure 3). It is so convenient for visitors that they do not need a commentator to explain the exhibits. However, mobile exhibitions only have the English version of the commentaries. The translation process now is much easier than the old times, so the museum can improve it by using artificial intelligence to translate the majority of the commentaries into different languages and refine the translations through professional editors. It will save a lot of manpower, material, and financial resources and give the visitors a better experience.

Figure 3

Then I followed the map and went to the third floor. When I arrived at the third floor, I saw an electronic screen on the wall (figure 4). Some of the visitors was looking at the screen and tried to find the collection that they wanted to see. On the third floor, it was exhibiting the furniture and decorations of the house. Visitors were watching the introduction videos which were projected on the wall. I have visited the latest exhibitions and events page from the MoMA website in advance and found Lincoln Kirstein’s Modern exhibition is on display. I went to the entrance of the exhibition hall and a lady asked me if I had the membership card because this collection was only open to members. I took out the card and she scanned the two-dimensional code on the back of the card and let me in. Compared to the traditional ways of verifying visitor information, this indeed is a new and efficient way to admit the visitors to the special exhibitions.

Figure 4

Figure 5

On the fourth floor, the art pieces were combined with technology and created a strange but special and novel feeling (figure 5). The dynamic space guided the visitors to look around and listen to the sound. The dark room, the bizarre lights and shadows accompanied by the background music let people experience the wonder and beauty of art (figure 6). I like these art items because when technology gets involved, everything becomes different and new. In Georgia Guthrie’s article “Art+Technology = New Art Forms, Not Just New Art”, she answered people’s question– “Why should we even try to use technology in art?” with this: “Because using technology in art has the potential to create entirely new art forms, and therefore new experiences for us that can be thrilling, illuminating, and just plain fun”. Technology is not only changing the pace of our lives but also shifting our appreciation of beauty in life. Technology gives us infinite possibilities to explore the beauty of the world. I am looking forward to seeing more intelligent art forms and art pieces in the future because our technology is developing rapidly day after day.

Figure 6

Finally, I got to the fifth floor where it was very crowded. The worldwide famous painting The Starry Night by Vincent van Gogh was exhibited on this floor. People come to see this world-famous painting excitedly, whether or not they have an artistic background. People recorded the special moment by taking photos of the painting (figure 7). Some people did not turn off the flash, so the security guy reminded the visitors again and again. It is better to have a sign on the wall in an obvious place to remind the visitors so that the security guy does not need to remind the visitors all the time.

Figure 7

Conclusion:

I enjoyed this observation and found out how people interacted with the information in a museum. In the article Fundamental Forms of Information, Marcia J. Bates says: “Anything that human beings interact with or observe can be a source of information”. The museum is a very important place for people to experience and absorb information. Bates writes that recorded information is communicatory or memorial information preserved in a durable medium(Bates 4). The documents and photos in the museum are recorded information. People read the documents and watch the photos on display and feel the history of the exhibits that satisfies their needs for aesthetic and the desire for knowledge. The museum is a medium to communicate cultures, a force to promote social change and development, and one of our most important wealths in the world.

References:

Guthrie, Georgia. “Art + Technology = New Art Forms, Not Just New Art | Make:” Make, Maker Faire, 31 Jul. 2018,https://makezine.com/2013/11/15/art-technology-new-art-forms-not-just-new-art/.

Bates, Marcia J. “Fundamental Forms of Information.” Journal of the American Society for Information Science and Technology, vol. 57, no. 8, 2006, pp. 1033–1045., doi:10.1002/asi.20369.

Xi Chen INFO 601-02 Assignment 3 Observation


Data Through Design – Panel Discussion: Everything is a Proxy

“Data Through Design – Panel Discussion: Everything is a Proxy” was a part of the Data x Design exhibition and NYC Open Data Week. It provided a platform for the audience to learn more about artists’ creative process. The event created a unique opportunity for live communication with exhibiting Data x Design artists about their design experience based on open data. The objective of this event was to encourage students to create new methods of map-making, develop a deeper understanding of life in the city and provide a wider knowledge of NYC’s open data. The event was held in the New Lab – Brooklyn Navy Yard. It was an open space where every visitor could test the functions of any interactive exhibits.

One of the sponsors of this event was Pratt Institute Spatial Analysis and Visualization Initiative. SAVI is a geographic information system-centered research and service that uses mapping, data, design, and visualization to understand and empower urban communities. They enable students to make data-driven maps and visualizations to solve real-world problems.

Let’s take a look at some of the projects:

  • NYC Trees Soundscape

The authors of the project used a combination of six data sets to create an imitation of sounds on the streets of New York. Viewers can choose a route on an interactive map using a touchscreen and listen to the audio that simulates the environmental sounds in this location.

  • Cards Against Hate

Based on the annual “NYC Reported Hate Crimes” dataset, the project presented cards demonstrating the number of actual hate crime incidents with the real stories. The main goal of the project was to bring more attention to investigation of hate crimes and bias incidents in the US. Also, the authors hope to provide deeper insight into the nature of hate crimes among different social groups.

  • Exhausted New York

To design the installation, the artist researched the air quality index and compared it to the asthma rates among New Yorkers. Based on this information, she concluded that invisible problems of air pollution is one of the biggest in NYC. The aim of Exhausted New York visualization is to demonstrate how polluted the air that we breathe is.

Data-driven events are a great way to engage students in the creative process and encourage them to apply their digital skills. All projects were based on open data sets and the participants ’own experiences. All the artists used indigenous knowledge as a background for their projects. The artists analyzed the relevant issues for NYC and found a unique solutions. They offered fresh ideas to solve urban problems such as traffic jams, train delays and long lines. Open data sets help to present a­­ccurate and relevant information in physical space through digital visualization. With each project, data become more emotional. This process displays the application of the Data-Information-Knowledge-Wisdom model by Ma Lai (Meanings of information: The assumptions and research consequences of three foundational LIS theories). The authors of the projects turn the data into up-to-date city management, optimized delivery and service routes, and efficient strategic planning. 

The artists analyzed statistics and data correlations in their field of study to create the projects. Research that they conducted helped them investigate the specific issues of the city from different sides and create a unique solution as a result. Digital tools and open data allow artists to be able to say what they want to say. The process of interaction between the artist and data illustrates ideas from the “Human–information interaction research and development” article by Gary Marchionini.

In the process of working on their projects, the participants encountered some difficulties. Some of the datasets were incomplete and they had to read between the lines to fill in the gaps. In addition, artists had to take into account the historical, economic, and social contexts in which they used the data.

At the last part of the event, we discussed the issue of data education for high school students. Everyone who participated in the discussion agreed that in the next 20 years the curriculum will include data handling subjects to teach children to analyze and protect data.

To create their projects, participants worked on data, analytics, mapping, design, and visualization in collaboration with different departments of various universities and sponsoring organizations. Cooperation and team work helped create an enviroment where faculty and students could share ideas across disciplines to make government services more accessible, efficient and responsive to the public needs.

Before attending the “Data Through Design – Panel Discussion: Everything is a Proxy” event, I thought that open datasets were difficult to understand and they couldn’t be applied to solving modern urban problems. After participating in the discussion, my opinion about open data changed. I realize that it is a great sourse for innovative projects that could change our environment.

More information about the event is available on the website.: https://www.eventbrite.com/e/data-through-design-panel-discussion-everything-is-a-proxy-tickets-57713713270#

INFO 601-02 Assignment 3: Event attendance by Elena Korshakova

Observation: Ridgewood Community Library

Ridgewood Library building
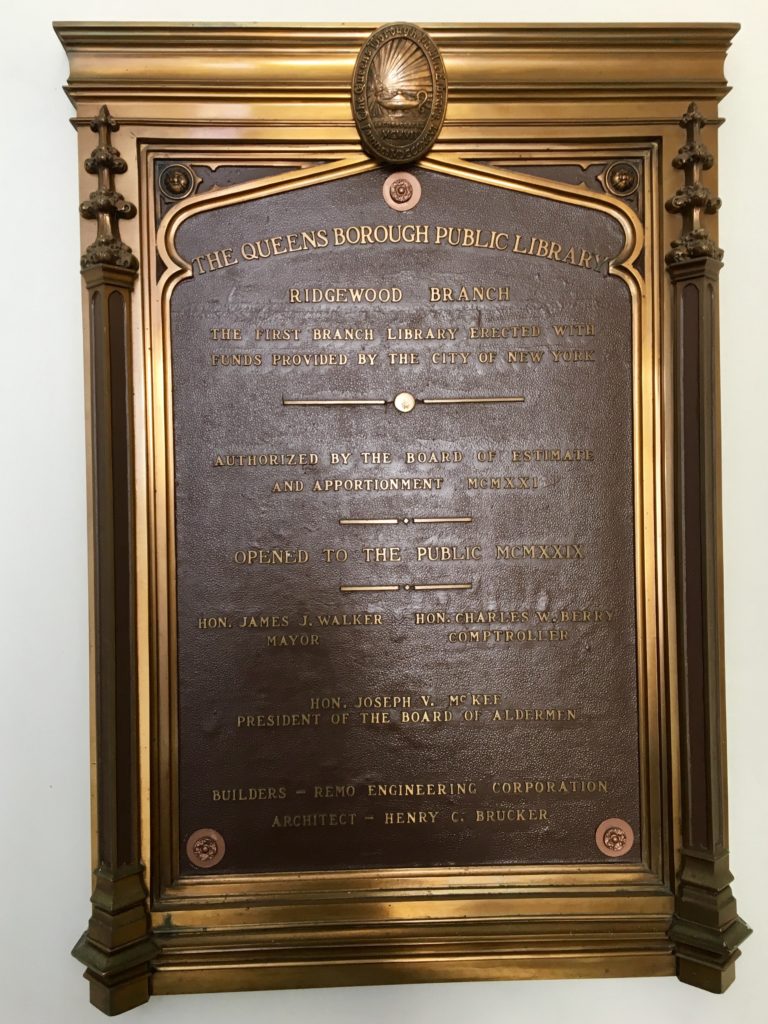
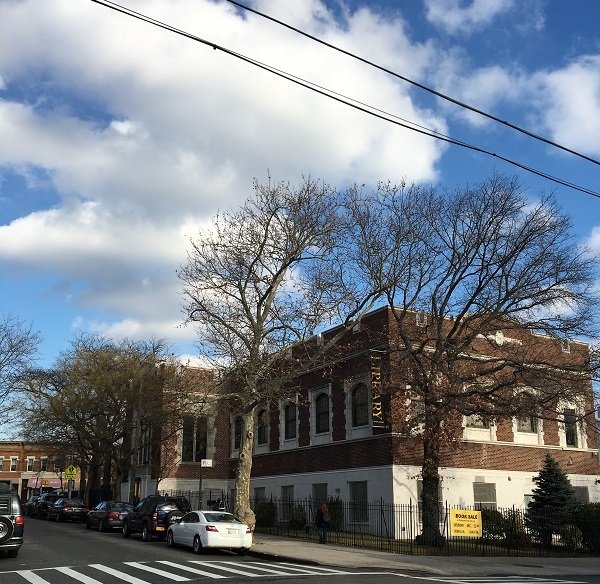
This week, I visited the Ridgewood Community Library, a branch of the Queens Library. Even though this is my neighborhood library, I had never spent time there except to pick up books I’d had transferred. The library is a fairly small branch housed in a beautiful brick building built in 1929. It was the first branch of the Queens Library to be constructed with funds from the city rather than from Andrew Carnegie. Renovated most recently in 2011, the library is fully accessible, with elevator access to every level. It is clean and well lit, with lots of natural light on the main level.

Ridgewood Library plaque


After entering the building at street level, I went downstairs to see the large meeting room for events, as well as a dedicated children’s room, which houses all of the children’s material. This room has its own circulation and reference desks, computers, and bathrooms.

The indoor book drop is located on this level just outside of the children’s room. The outdoor book drop is located down a ramp next to the main entrance, which allows for 24-hour book return. Both book drops use a computerized system with a retractable metal flap that opens when materials are placed on a conveyor belt. This system usually works smoothly, but I have had issues such as the machine being out of order or not sensing books that I placed on the belt.

I next went up one level from the entrance to the large main floor of the library, which houses the teen and adult sections. At the circulation desk at the center of this room, as well as the one in the children’s room, checking out books is fully automated, with a touchscreen monitor and a pad that senses library cards and books. This system is fairly straightforward to use, although in my experience, it’s not always clear how to complete the checkout process, and I’ve seen other people having difficulties as well. I think that instructions for checking out could be relayed more clearly on-screen.

The reference desk on this floor is positioned by the back wall toward the middle of the room. At the reference desk, patrons can sign up for the 20 teen and adult computers located in a balcony area, which offer free internet access, Microsoft Word, and limited free printing. A desk near these computers provides technical support. There is only one single-occupant bathroom for the entire floor, although I do appreciate its being labeled with the inclusive term “all-gender.”

This branch has different hours every day of the week, and is closed on Sundays. Ideally, it would have more consistent and longer hours to better serve patrons. I visited on a Tuesday, when it’s only open from 1 p.m. to 6 p.m. I asked the librarian at the reference desk if this issue was budget-related, but he explained that Tuesday has always been a short day due to staff training in the morning. The reference librarian did mention austerity measures currently in place that affect how many new materials the branch can acquire. The library’s programming, fortunately, is robust and seems to reflect the diverse population it serves. On its website, I saw a wide array of free programming, including kids’ Jeopardy, English as a Second Language (ESOL) lessons, a class on dealing with stray and feral cats in the neighborhood, a Financing Your Education session, and Flamenco dancing.

This branch is also impressive for its collections in languages that reflect Ridgewood’s immigrant population. In the adult section, there are designated shelves for languages including Albanian, Polish, Serbian, and Spanish. There is also a “New Americans” section geared toward immigrants, with videos, books, information pamphlets, and ESL materials. The literature near the circulation desk advertising library and community resources is printed in many languages. Having lived in Ridgewood for more than five years, I can attest to the large Eastern European and Spanish-speaking populations.

Ridgewood Library New Americans area


When I arrived at 1:30 p.m., the library was very quiet. Once school let out though, the teen section filled up and became loud and boisterous. Conversations reached the point of yelling, and because there weren’t enough tables or chairs, some students sprawled out on the floor. Since the teen and adult sections share the main floor, this noise filled the entire area and made it difficult to focus or hear the reference librarian as he answered a question.

While I think it’s great that teens are using the library, a more separate teen area like the younger children have would be ideal, as it would allow the rest of the library to remain a (reasonably) quiet environment. The reference librarian on the main level said that it can be a challenging place to work just because it does get so busy and loud. To me, these issues speak to the ever-present tension between providing access to everyone and ensuring that all groups of patrons have a good experience at the public library, all while dealing with space and budget constraints.

It seems like the best option for addressing the high volume of patrons at the Ridgewood branch would be to expand the building or move to a new location. Alternately, perhaps an additional neighborhood branch would help to address some of these issues. Of course, this is dependent on funding from the state and city governments as well as private sources. This blog post from YALSA (Young Adult Library Services Association) gives recommendations for dealing with noise and disruptions from teens after school when expanding isn’t an option. Suggestions include rearranging shelving and furniture to create noise barriers, opening up meeting rooms for teen use after school, and scheduling programming and activities for teens during this time.

Overall, while the Ridgewood branch faces challenges, I do think it’s doing a great job of targeting materials, programming, and resources to the needs and interests of the community it serves.


Observation of the Cooper-Hewitt Smithsonian Design Museum

When considering the kind of information environment I wanted to observe, I wanted to observe an institution whose mission centered around engagement with and education about art objects. I chose to observe the Cooper-Hewitt Smithsonian Design Museum as it is known  as a trailblazer in the field of interactive museum experiences.  I believed I would have the opportunity to observe the intersection of people, technology, and art collections in one space.

I visited the Cooper-Hewitt during a weekday morning shortly after it opened for the day. The Cooper-Hewitt is a converted mansion on the Upper East Side, situated in the middle of Manhattan’s “Museum Mile.” It is known as the Mecca of museum interactives, with touch screen and immersive digital tools featured prominently in almost every gallery space.

After I entered the museum, myself and a few other visitors made our way to the ticketing counter. There, we were given a demonstration of the museum’s most notable digital tool, the digital “pen.” The visitor services associate held up a sample wall label explaining if we pressed the end of the pen to a cross symbol on the label, we could save artworks we enjoyed. The works saved by the pen became a part of our own curated collection which we could access via an online code after our visit. I think this is an interesting way for the Cooper Hewitt to encourage their visitors to engage with works in the collection and continue their exploration outside of the museum.  As I stepped away from the counter, I observed another visitor approach the counter to ask an associate a question. The visitor pointed to his digital pen and asked “do you give out these out so I won’t take pictures in the gallery?” The associate assured the visitor that they could still take photographs with their cellphone, but encouraged them to try the pen. They explained the pen  provides clear images without the glare of the display cases, which the visitor can access at any time. The visitor did not seem entirely convinced, but made their way up to the main exhibition.

Interactive Tables: Interacting with the Web of Objects (Left) and Design Studio (Right)

As I made my way to the  second floor and into the main exhibition, Saturated: the Allure and Science of Color, I noticed display cases all around the room with multiple objects inside. Near the displays and scattered around the room were table-sized touchscreen tablets. When I arrived, many visitors were hunched  over the touchscreens with their pens in motion. Upon approaching the first table, I began reading the introductory text while other visitors continued to move their pens around the screen. The prompts on the table asked visitors “what will inspire you”, “what will you design,” and “be inspired.” Each screen table allowed four visitors at a time to design their own object and learn from a moving web of circles. Each orb in the web contained an object from the Cooper-Hewitt’s extensive permanent collection. From observing visitors at these tables, older patrons seemed to be apprehensive of the display oftentimes, avoiding or not approaching the screens. Younger visitors appeared very comfortable with interacting with this kind of technology  and spent a majority of their visit designing their own virtual objects. Most visitors I observed did not interact with the moving web of images, instead opting for the more interactive features of the display. The touchscreen tables allowed visitors to engage with ideas from the galleries and actively design, but it seemed not many visitors were engaging with the wider collection in the way the museum was anticipating.

The Wall Label (Left) and the Pen (Right)

Observing visitors with the pen was more interesting. With the large tables, it appeared that many visitors approached the screens, because they were unfamiliar with its presence in a traditional museum gallery. Their curiosity with the technology seemed to be its main draw. Despite unfamiliarity, they had some inherent ease using the touchscreen technology, as I assume most visitors are already familiar with using a smartphone or iPad outside the museum. The digital pen was a little different as it is a piece of technology foreign to most people. and takes some effort to become comfortable with it. I observed many visitors struggling to save objects with their pens. A few visitors, frustrated with this process, let the pen dangle from the wrist-strap while they proceeded to take photos with their smartphones. It appeared patrons were either very engaged with the digital pen technology or ignored it all together. From my perspective, if a visitor was feeling apprehensive in this technologically dense environment, their interaction with the pen was the first thing to go.

In many ways, the Cooper-Hewitt functions as an information dense environment. The museum allows their patrons to engage with works on view, but also tap into their larger collection through the use of interactive technology. Given its density and foreign technologies, I found that many visitors’ “information seeking behaviors” were affected by what Elfreda Chatham defines as a sense of risk-taking. Visitors to the museum, in order to trust the information from the  Cooper-Hewitt’s exhibitions, needed to trust the new technology as their connection to the information. I think the risk of not understanding how to use the pen or the touchscreen tables, made some visitors avoid the information all together.


Sources

Chatman, E. A. (1996), The impoverished life‐world of outsiders. J. Am. Soc. Inf. Sci., 47: 193-206. doi:10.1002/(SICI)1097-4571(199603)47:3<193::AID-ASI3>3.0.CO;2-T