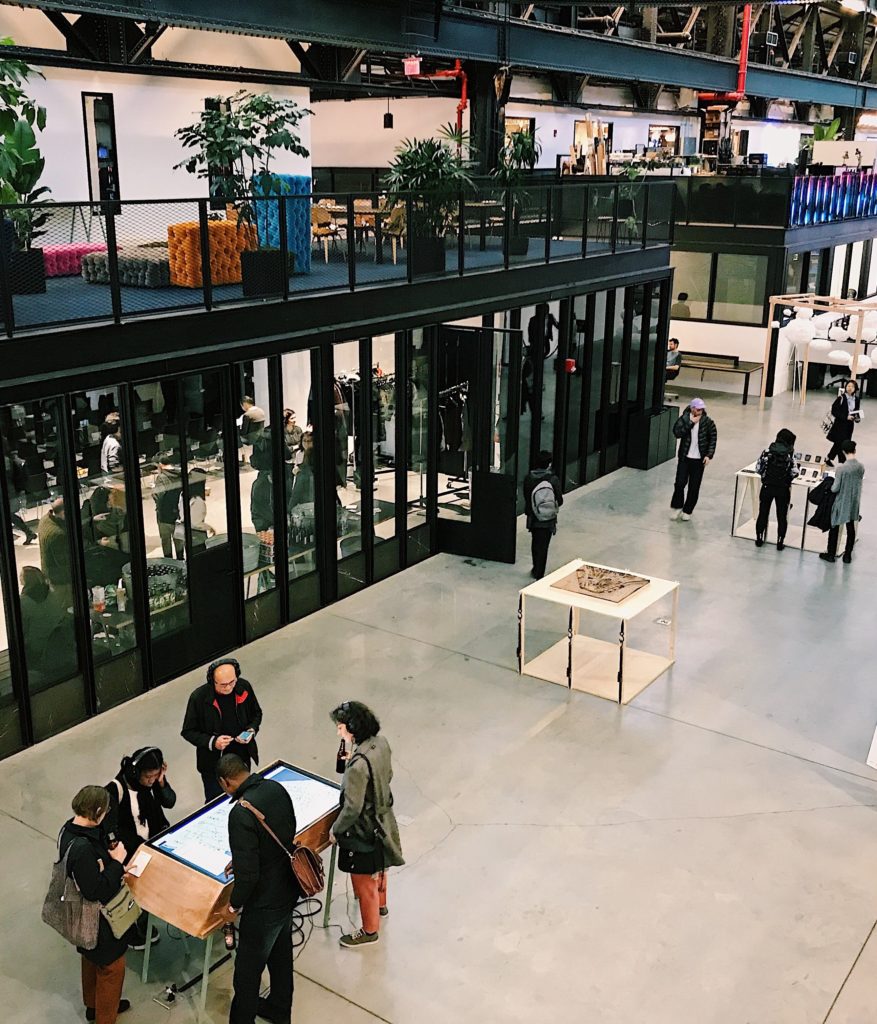
“Data Through Design – Panel Discussion: Everything is a Proxy” was a part of the Data x Design exhibition and NYC Open Data Week. It provided a platform for the audience to learn more about artists’ creative process. The event created a unique opportunity for live communication with exhibiting Data x Design artists about their design experience based on open data. The objective of this event was to encourage students to create new methods of map-making, develop a deeper understanding of life in the city and provide a wider knowledge of NYC’s open data. The event was held in the New Lab – Brooklyn Navy Yard. It was an open space where every visitor could test the functions of any interactive exhibits.
One of the sponsors of this event was Pratt Institute Spatial Analysis and Visualization Initiative. SAVI is a geographic information system-centered research and service that uses mapping, data, design, and visualization to understand and empower urban communities. They enable students to make data-driven maps and visualizations to solve real-world problems.
Let’s take a look at some of the projects:
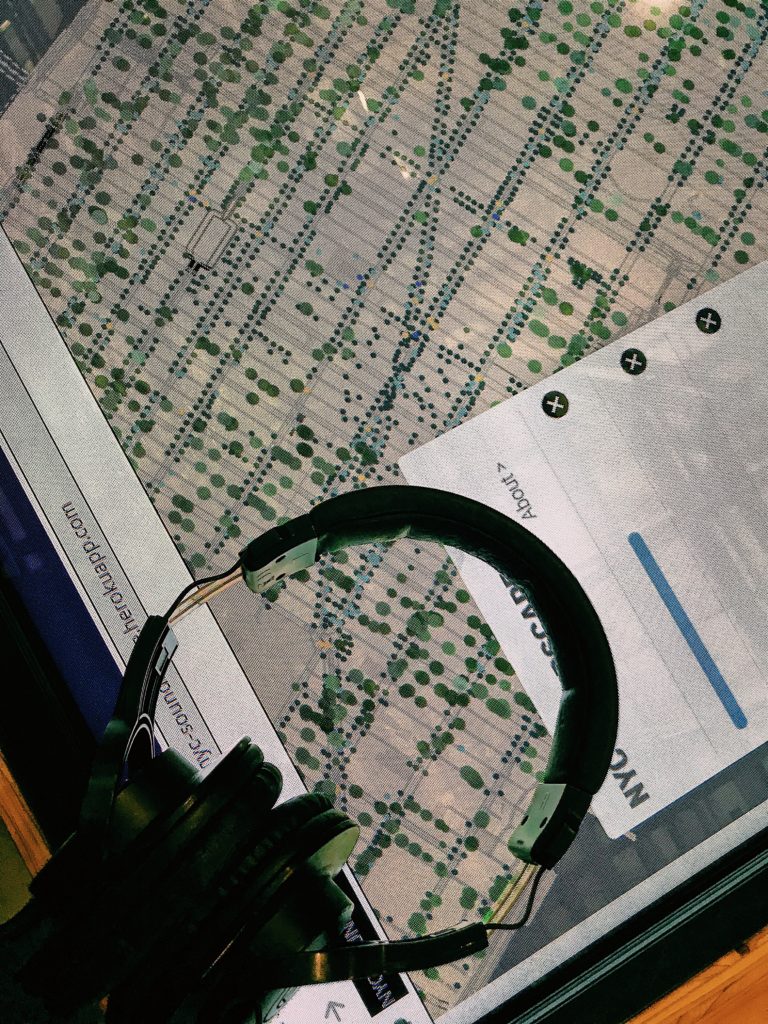
- NYC Trees Soundscape
The authors of the project used a combination of six data sets to create an imitation of sounds on the streets of New York. Viewers can choose a route on an interactive map using a touchscreen and listen to the audio that simulates the environmental sounds in this location.
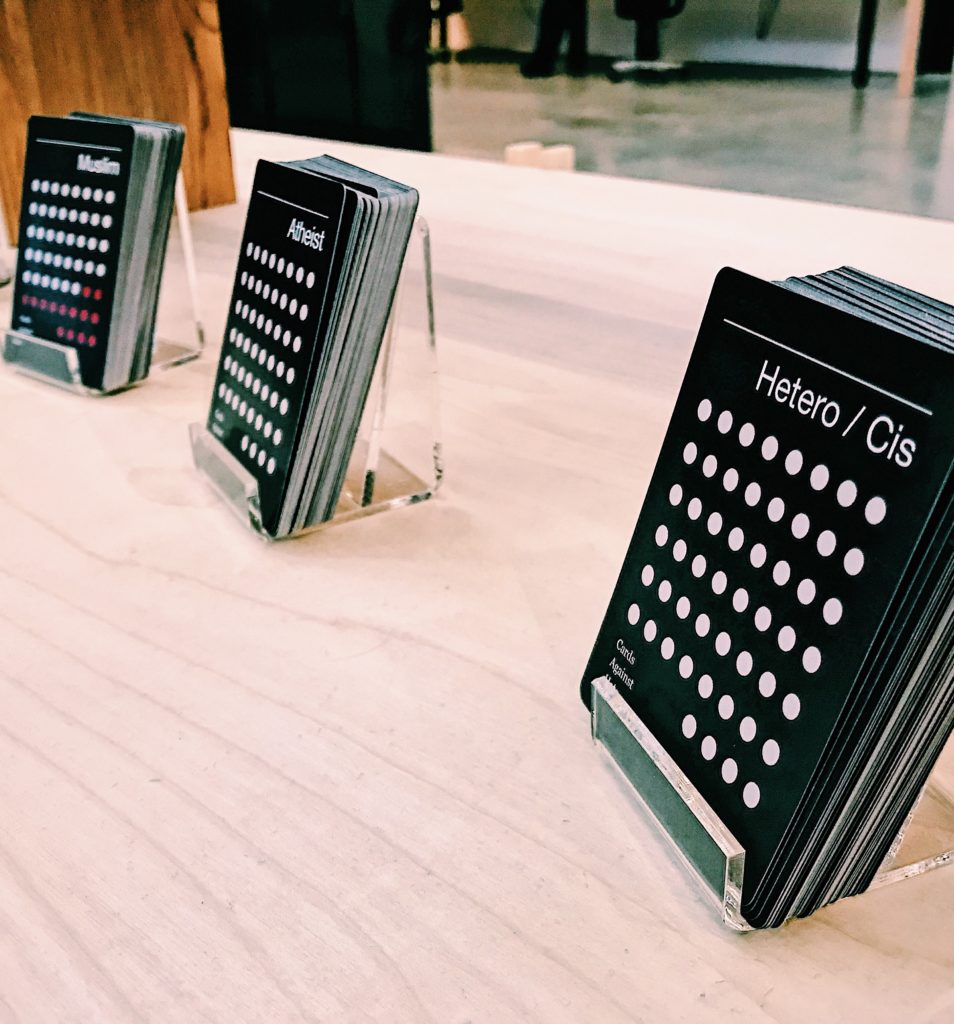
- Cards Against Hate
Based on the annual “NYC Reported Hate Crimes” dataset, the project presented cards demonstrating the number of actual hate crime incidents with the real stories. The main goal of the project was to bring more attention to investigation of hate crimes and bias incidents in the US. Also, the authors hope to provide deeper insight into the nature of hate crimes among different social groups.
- Exhausted New York
To design the installation, the artist researched the air quality index and compared it to the asthma rates among New Yorkers. Based on this information, she concluded that invisible problems of air pollution is one of the biggest in NYC. The aim of Exhausted New York visualization is to demonstrate how polluted the air that we breathe is.

Data-driven events are a great way to engage students in the creative process and encourage them to apply their digital skills. All projects were based on open data sets and the participants ’own experiences. All the artists used indigenous knowledge as a background for their projects. The artists analyzed the relevant issues for NYC and found a unique solutions. They offered fresh ideas to solve urban problems such as traffic jams, train delays and long lines. Open data sets help to present accurate and relevant information in physical space through digital visualization. With each project, data become more emotional. This process displays the application of the Data-Information-Knowledge-Wisdom model by Ma Lai (Meanings of information: The assumptions and research consequences of three foundational LIS theories). The authors of the projects turn the data into up-to-date city management, optimized delivery and service routes, and efficient strategic planning.
The artists analyzed statistics and data correlations in their field of study to create the projects. Research that they conducted helped them investigate the specific issues of the city from different sides and create a unique solution as a result. Digital tools and open data allow artists to be able to say what they want to say. The process of interaction between the artist and data illustrates ideas from the “Human–information interaction research and development” article by Gary Marchionini.
In the process of working on their projects, the participants encountered some difficulties. Some of the datasets were incomplete and they had to read between the lines to fill in the gaps. In addition, artists had to take into account the historical, economic, and social contexts in which they used the data.
At the last part of the event, we discussed the issue of data education for high school students. Everyone who participated in the discussion agreed that in the next 20 years the curriculum will include data handling subjects to teach children to analyze and protect data.
To create their projects, participants worked on data, analytics, mapping, design, and visualization in collaboration with different departments of various universities and sponsoring organizations. Cooperation and team work helped create an enviroment where faculty and students could share ideas across disciplines to make government services more accessible, efficient and responsive to the public needs.
Before attending the “Data Through Design – Panel Discussion: Everything is a Proxy” event, I thought that open datasets were difficult to understand and they couldn’t be applied to solving modern urban problems. After participating in the discussion, my opinion about open data changed. I realize that it is a great sourse for innovative projects that could change our environment.
More information about the event is available on the website.: https://www.eventbrite.com/e/data-through-design-panel-discussion-everything-is-a-proxy-tickets-57713713270#
INFO 601-02 Assignment 3: Event attendance by Elena Korshakova