“Department heads painstakingly compile reports and analyses filled with data which are sent to executives every week. The pages are barely skimmed, if read at all. Network and security operation centers line the walls with giant screens, displaying dashboards powered by expensive big data analytics. No one ever takes more than a passing glance on the way to lunch. If data is so essential, why is it so easily ignored? Many data initiatives fail to make a real impact.”
On April 10, 2019 I attended “Why No One is Looking at Your Data”, an event hosted by Meetup featuring Clare Gollnick, the Director of Data Science at NS1. Clare Gollnick started her career as a Neuroscientist and holds a PhD from Georgia Tech and a BS from UC Berkeley. As an expert on statistical inference and machine learning, she writes and speaks often on the intersection of data, philosophy, and entrepreneurship. She was previously Chief Technology Officer of Terbium Labs, where she led a diverse team of engineers and researchers. The team released novel data intelligence solutions which prevents credit card fraud while still protecting consumer privacy. Clare has published a number of academic papers on information processing within neural networks, validation of new statistical methods and the philosophy of science.
The presentation was focused on the difference between data and information, designing data dashboards and data products and “Why No One is Looking at your Data”.
Clare starts off her presentation with the scene from Douglas Adams’ novel series, The Hitchhiker’s Guide to the Galaxy to demonstrate how difficult it is to understand data without any context. In short, a race of hyper-intelligent, pan-dimensional beings had built an enormous supercomputer named Deep Thought, which calculated over a period of 7.5 million years to answer the meaning of: life, the universe, and everything. After 7.5 million years of calculation, the pan-dimensional people gathered eagerly to watch Deep Thought finally announce the answer they have been waiting for.
The answer was “42”. But what does “42” mean? Data can mean absolutely nothing if you do not provide it with context.
Practical suggestions were provided from the presentation such as choosing initiatives for investments, and providing valuable data to deliver useful and interpretable information. To understand the personal mental logic process while looking at data, Clare provided a demonstration and suggestions on how to make inferences.
The first and most obvious suggestion was to add units to the data. Using “42” as a random piece of data, adding kilogram (kg) to 42 would make 42 into 42kg. A kilogram is a SI unit of mass, an international standard, which scientists have based their definition of the fundamental unit of mass on a a shining platinum iridium cylinder stored in a locked vault in France. However, most people have not seen this cylinder, and they would be considered non- experts. Yet they are able to develop a concept of what a kilogram means by having shared experiences with other items labeled kilogram throughout their life. For example, people at the gym might have a concept of a kilogram based on the weights they would use for a specific workout done in the past. This method can be applied with any form of information, and can be built upon as well. “Cat” was then added to 42kg, further explaining the mental logic in understanding the context of 42 kg while visualizing a 42 kg cat. Claire further explains that a person with knowledge about cats (an expert) might visualize a larger cat, such as a leopard.
Segmenting the market or the audience into experts and non-experts may be the result of a single piece of data. An expert would be someone who has a solid understanding of the given information, whereas an non-expert would have considerably less knowledge.
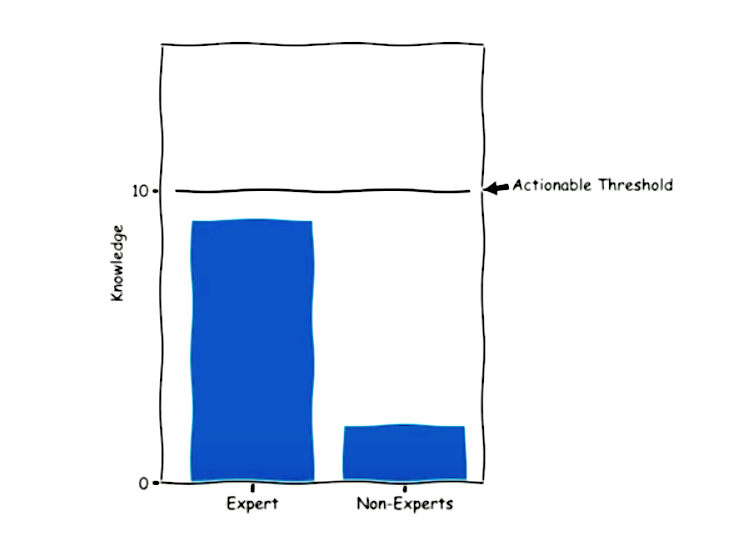
Data results from the mental model might be different given the knowledge gap between the expert and non-expert. Experts use data more effectively, and therefore reach a “threshold” in which something is actionable. Given a single piece of data, the expert crosses that threshold and catapults into another stratosphere of other questions and other types of issues they might want to know about the data. Meanwhile, non-experts are unable to obtain the minimum knowledge required to alter their action. An expert with more familiarity of the subject might ask for the raw data because they know what to do with it, whereas the non-expert would be clueless. Clare emphasized that this dynamic creates challenges for those trying to design a product. The goal of a product should deliver repeatable and scalable value with consistent outcomes across the entire target market. When you end up in this middle ground, you are stuck with a wall of data which is not viewed or seen. Experts find data at the source while others attempt to interpret information on the dashboard.
Data Does Not Speak For Itself
The presentation take away was the difficulty in making sense of data when it does not speak for itself. This belief is addressed in Boyd and Crawford’s article, Critical Questions for Big Data: Provocations for a Cultural, Technological, and Scholarly Phenomenon”. Where Big Data provides ‘destabilizing amounts of knowledge and information that lack the regulating force of philosophy’ (Berry 2011). To understand data, there needs to be context. As mentioned in the the article Critical Data Studies: An Introduction by Andrew Iliadis and Federica Russo, data is apprehended through various levels of informational abstraction (Floridi, 2011). Big data is framed within levels of informational abstraction, where the product of positionalities constrain and afford a gateway into multiple data roles including abstraction which may be adopted, manipulated, or repurposed for any number of aims. This is a crucial part of giving sense to data. Choosing a level of abstraction from which to view Big Data alters the types of conversations that can be had about data, its aims, and functions (Iliadis, Russo 2016).
Conclusion
When you fail to recognize that data is difficult to understand, you can wind up with mismatched expectations between what is promised and delivered within a data project. Overall, the main suggestion was the need for inferences, or making a comparison to existing knowledge. Data can only inform once you already know something. You need knowledge to gain knowledge.
References:
Berry, D. (2011) ‘The computational turn: thinking about the digital humanities’, Culture Machine, vol. 12, [Online] Available at: http://www.culturemachine.net/index.php/cm/article/view/440/470 (11 July 2011).
Danah Boyd & Kate Crawford (2012): Critical Questions For Big Data, Information, Communication & Society, 15:5, 662-679 http://dx.doi.org/10.1080/1369118X.2012.678878
Floridi, L (2011) The Philosophy of Information, Oxford: Oxford University Press. https://doi.org/10.1111/1467-9973.00221
Gollnick, C. (2019, April 10). Why No One is Looking at Your Data. Lecture presented at Meetup: UX+Data, New York.
Iliadis, A., & Russo, F. (2016). Critical data studies: An introduction. Big Data & Society. https://doi.org/10.1177/2053951716674238