We banded ourselves together, moved by a sense of stricken guilt, to prevent this kind of disaster from ever happening again.
Frances Perkins, witness to the Triangle Shirtwaist Factory Fire, U.S. Secretary of Labor (1933-1945), and the first woman appointed to the U.S. Cabinet.
INTRODUCTION
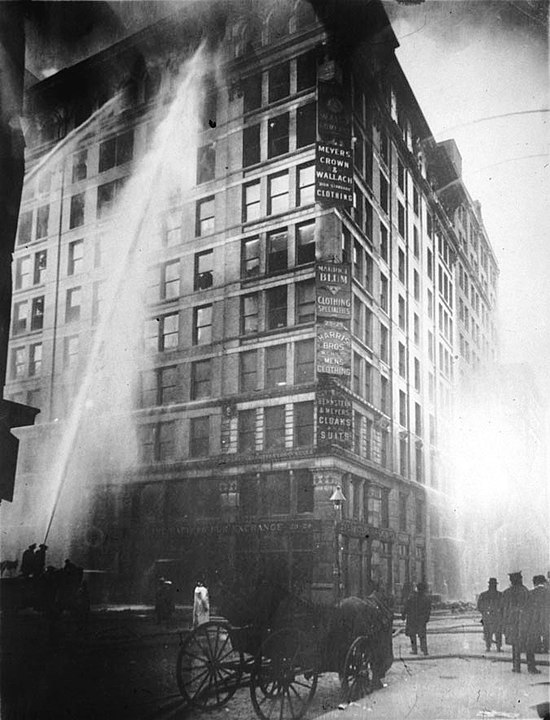
Can we use geospatial tools to explore the human condition and tragedy? The Triangle Shirtwaist Factory Fire Revisited: A Geospatial Exploration of Tragedy aims to do just that, by introducing the viewer to a historical event, the Triangle Shirtwaist Factory Fire of 1911, through the use of interactive geospatial technology. The project presents the viewer with information about the event, including the home addresses of all 146 victims of the Triangle Shirtwaist Factory Fire, identified by green points on a map. The viewer then has two options for exploring, they may scroll through the side story panels to view archive photographs and circumstances surrounding the fire or click on individual points in the map to reveal information about the victims who lived there.
BACKGROUND
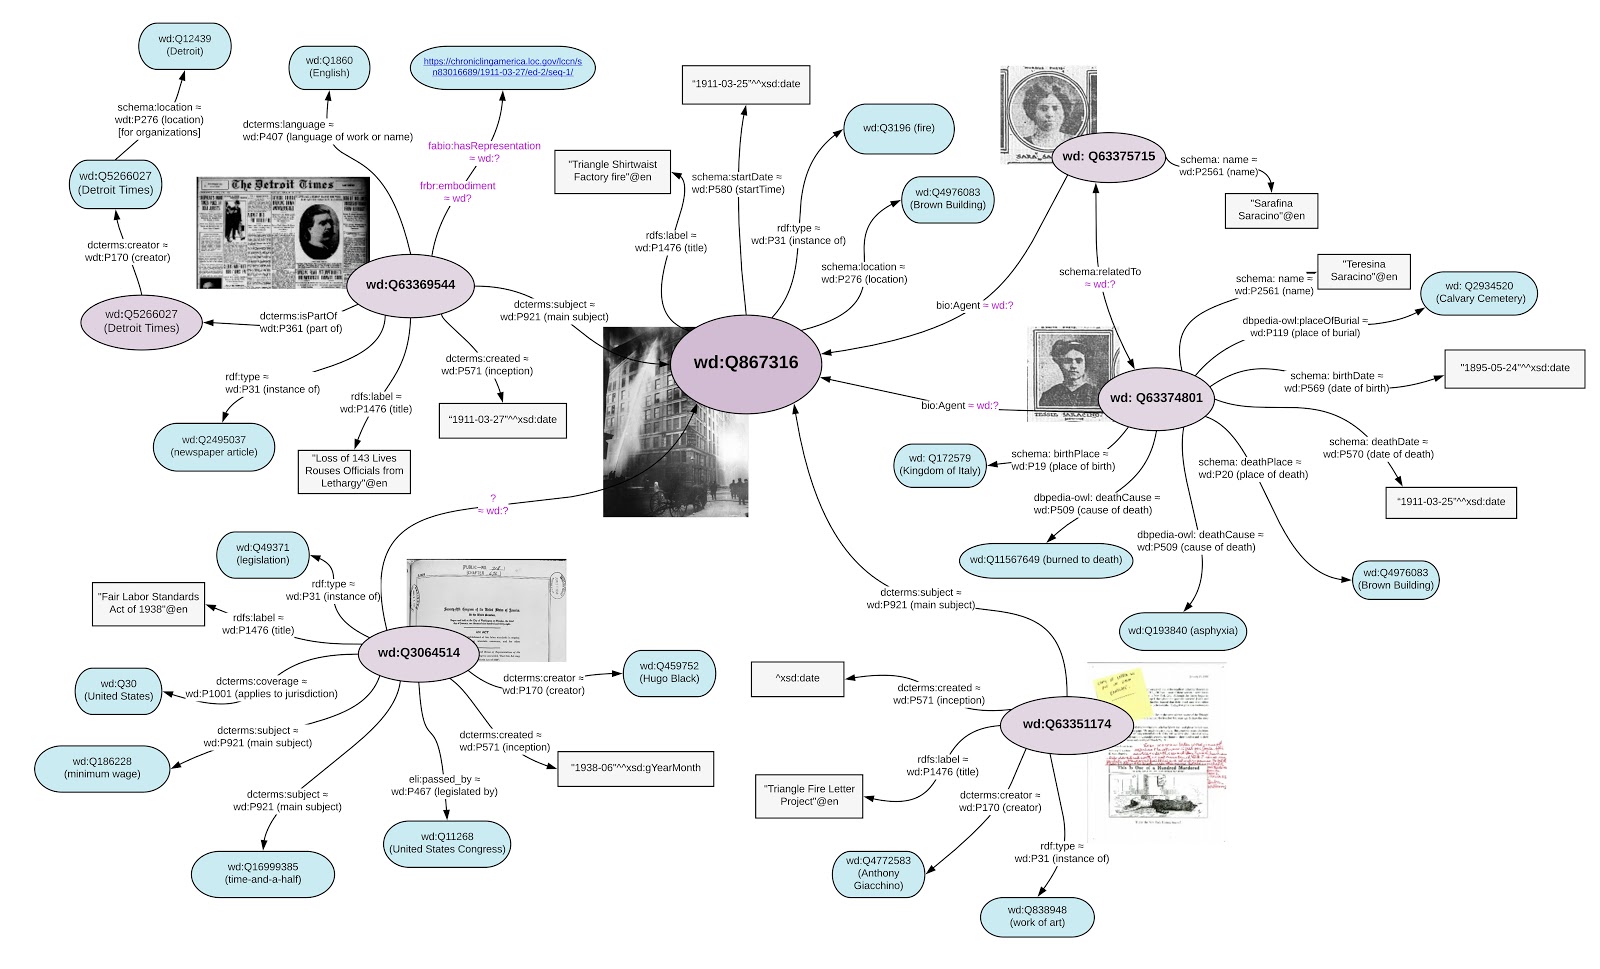
The impetus for the project, the Triangle Shirtwaist Factory Fire Revisited: A Geospatial Exploration of Tragedy, came about as the result of work on another project dealing with the same subject matter, the Triangle Shirtwaist Factory Fire of 1911, while writing an Institute of Museum and Library Services (IMLS) grant proposal for my course, Linked Open Data for Libraries, Archives, and Museums (INFO 670) this spring. The IMLS grant would fund the creation of a proof of concept semantic data model for introducing linked open data technologies and principles through the exploration of historic events for grades 6-12 called People’s Linked History. The data model was created with underrepresented stories related to historic events in mind, and we chose to build our model on the Triangle Shirtwaist Factory Fire of 1911 as our example data set. The model we built provides a structure both for educators and students to explore and present information about a given historical topic, as well as for students to complete projects related to historical events. Particular emphasis is placed on connecting disparate documents and information about significant but underrepresented historical events. People’s Linked History enables the use of linked open data to uncover siloed documents and information, bringing them together in a singular context for a more intimate understanding of an event and the primary sources documenting it. The surprise we found as we built the linked open data project, was that it did exactly what we wanted the model to do, except it did it to us: we found a ton of hidden information based on historical research through a linked data framework. This research created an exponential potential for serendipitous learning, essentially lifting the learning of history “out of the textbook”; making it real, and in the end “we got schooled by our own project!”
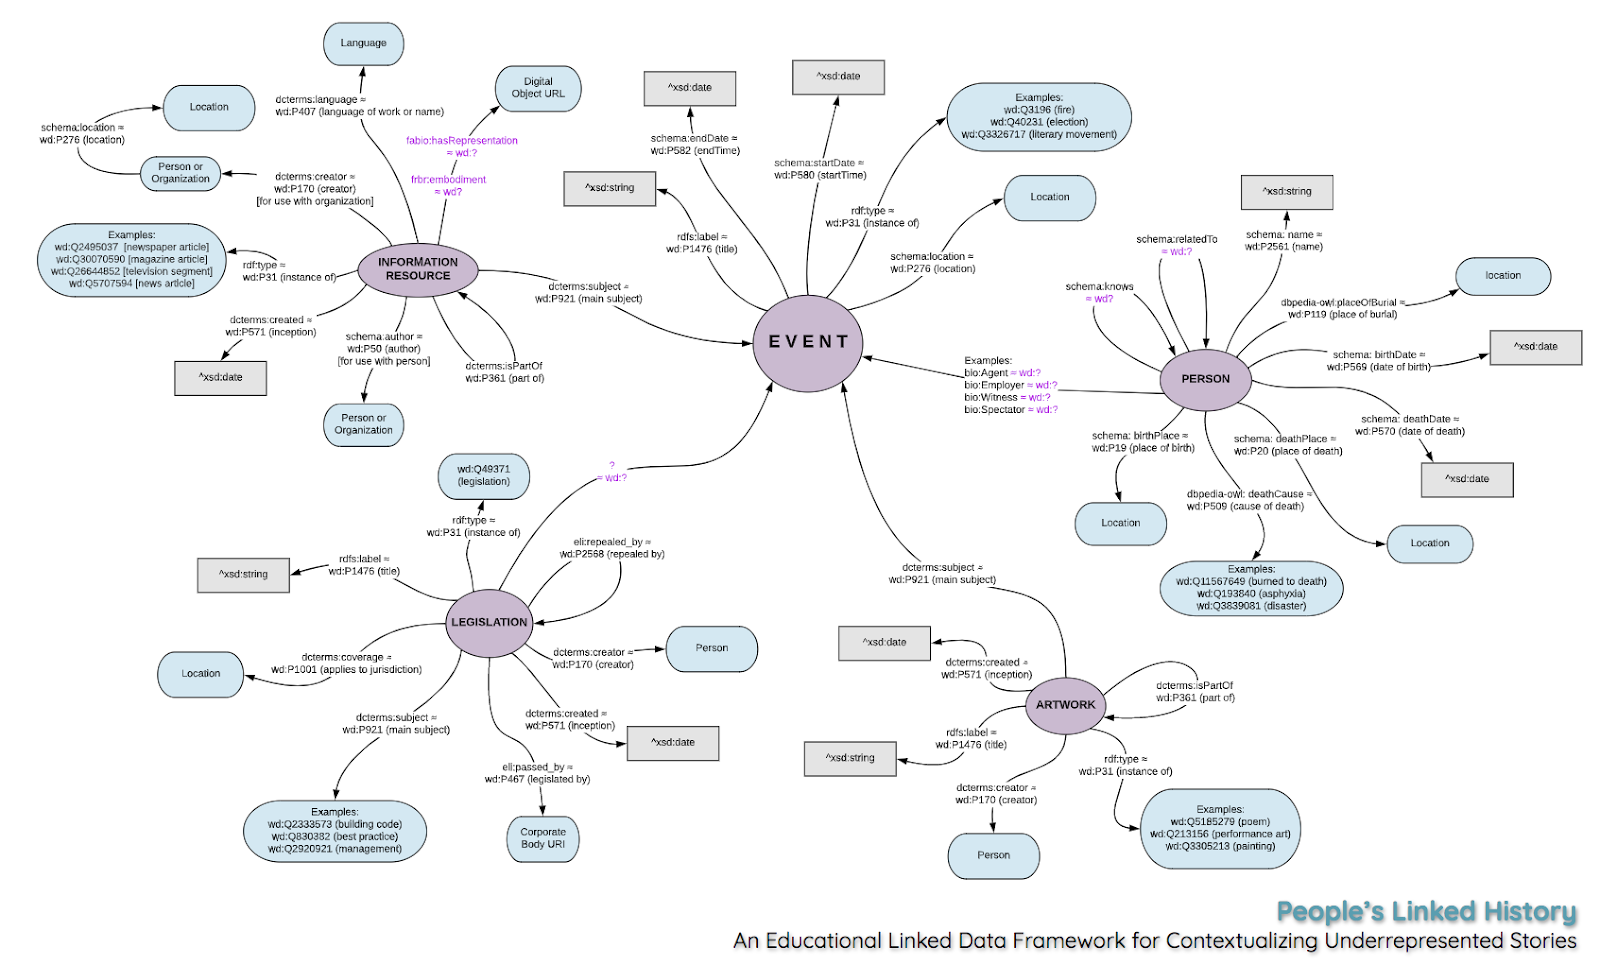
Modeling historical events with this linked open data framework revealed thought-provoking connections and avenues for further research, one of which is the digital humanities project presented here: the creation of an exploratory, educational model that works as a memorial and reflection on the magnitude of the Triangle Shirtwaist Factory Fire, and that will engage the user by showing them just how many people did not return to their homes that day through the use of maps, archive images and journalism.
With the considerable amount of data surrounding the Triangle Shirtwaist Factory Fire that our team had amassed during the People’s Linked History project, I was able to conceptualize additional uses for material. We had several comprehensive lists of the names of the victims, their home addresses and gravesite locations, legislation resulting from the event, and artwork created in remembrance of or homage to the fire and I thought there has to be a way that I can explore and share this data further.
ENVIRONMENTAL SCAN – UNDERREPRESENTED STORIES: In the article “The Problem With History Classes: Single-perspective narratives do students a gross disservice”, Michael Conway (2015) challenges a set narrative or uniform collective story. He advocates for a historiographical (focusing on multiple perspectives of history, i.e. cultural, social, gender, etc.) rather than a traditional “diplomatic” historical approach. By incorporating this approach into the heart of my project, the viewer can use the map to uncover historical nuances and create a more holistic understanding of events.
In “Teaching the Voices of History Through Primary Sources and Historical Fiction: A Case Study of Teacher and Librarian Roles” Barbara K. Stripling (2011) writes that the ability to analyze alternative points of view and empathize with the beliefs, attitudes, and actions of others from their perspective are essential building blocks for learning in the 21st century. Taking this research into consideration, it is crucial for history teaching tools to be able to handle content that is more than just the straightforward timelines in textbooks.
This project can be a part of an educational digital revolution providing an exciting opportunity to reconsider how we teach history by using technology and mapping in the classroom. Christopher Young (2019) in “Embracing the Digital Revolution in the History Classroom,” suggests that by incorporating digital projects into the classroom, we can prepare students to not only analyze history, but also to help them develop additional skills.
While this type of mapping project can be used for exploring any historical event, adding archive documents, images, etc. will highlight elements and figures from the event that may not receive as much attention if the user was just reading about the event in a textbook. This type of project, then, can be an element of complicating the set narrative of history that, according to Michael Conway in his 2015 Atlantic article, does “students a gross disservice” (Conway, 2015). Different perspectives and the discussions that come out of these perspectives are lost when only one historical narrative is presented. With an interactive map, users can explore, views, sources, sub-events, and products of events and will be able to take part in and see the different elements of history.
METHODS
The data for the project was gathered from several different sources. The majority of the information was sourced from the Cornell University Kheel Center project Remembering the 1911 Triangle Factory Fire. Additional research was done in the New York University Tamiment Library & Robert F. Wagner Labor Archives in their New York City Immigrant Labor History Project Oral History Collection OH014 project, as well as searches done on the Triangle Shirtwaist Factory Fire at the Library of Congress.
Before I was able to begin building my geospatial exploration project, I had to:
- Reconcile and build a dataset from several documents containing address and name information from the victims of the Triangle Shirtwaist Factory Fire
- Geocode these addresses
- Import these addresses into ArcGIS and plot these to create a map
- Locate archive images and information about the victims of Triangle Shirtwaist Factory Fire
Now I was ready to create an interactive interface that would allow the user to explore the Triangle Shirtwaist Factory Fire. I chose to create this first iteration of the project in Esri Story Maps using their cascade builder template.
RESULTS
The original proposal for this digital humanities project was a single interactive map that would allow the user to explore a single historical event, the Triangle Shirtwaist Factory Fire, through the victims of that event. I imagined that all interaction would be done through that single map, but as I began building this map in Esri Story Maps, I realized that there was something missing. I had made a decision, incorrectly, to jump in with the victims before explaining to my users what the Triangle Shirtwaist Factory Fire was, essentially, the “why should I care” part of the project. I therefore needed to reevaluate the project structure and layout which resulted in a design change from a single map interface to a “cascade” style story. With this change, I believe my project works more efficiently as a pedagogic tool to help the user explore an important chapter of American history that would frequently get lost among the many incidents of the 20th century.
As a visual product, my project on The Triangle Shirtwaist Factory Fire is intended as an instance for future memorialization of both key historical events and the intrahistory of singular lives as in the case of the Saracino Sisters. Attention has been given not only to synthetic historical contextualization but also to the power of materialized memory in the shape of archive images. Aware of the implications of all my aesthetic choices, I have proposed a somber black and white palette to convey the tragic subject matter. In contrast, the maps show their life and death in contrasting colors of red (death and fire) and green (life). My digital humanities project The Triangle Shirtwaist Factory Fire Revisited: A Geospatial Exploration of Tragedy should, therefore, should be seen as a tentative approach to memorializing historical events and under-represented stories.
FUTURE DIRECTIONS
There are so many directions that this project could take, but the first would be to build this Story Map out into a comprehensive project that contained detailed maps for all 146 victims of the Triangle Shirtwaist Factory Fire. While all 146 victims have been added to the map as points, only a few selected archive items been added to the project. For the future, this project should encompass representation of all victims of the tragic fire. In addition to the individual maps for each victim, I would like to build out each victim’s profile by adding a location for the individual burial site or perhaps a single map showing all burial site locations for all 146 victims. Further to that and keeping with the original spirit of the People’s Linked History project, this type of geospatial interface could tentatively be used as model for future projects on underrepresented historical events, such as the 2004 Madrid train bombings in Spain (known in Spanish as 11-M).
SOURCES
146 lives lost! (n.d.). In Remembering the 1911 Triangle Factory Fire. Cornell University Kheel Center. Retrieved from https://trianglefire.ilr.cornell.edu/victimsWitnesses/victimsList.html
Conway, M. (2015). The Problem With History Classes: Single-perspective narratives do students a gross disservice. The Atlantic. Retrieved from https://www.theatlantic.com/education/archive/2015/03/the-problem-with-history-classes/387823/
Stripling, B. K. (2011). Teaching the Voices of History Through Primary Sources and Historical Fiction: A Case Study of Teacher and Librarian Roles. The School of Information Studies – Dissertations. Paper 66. https://surface.syr.edu/cgi/viewcontent.cgi?article=1066&context=it_etd
Young, C. (2019). Embracing the Digital Revolution in the History Classroom. Teaching History: A Journal of Methods, 43(2), 2-16. Retrieved from https://openjournals.bsu.edu/teachinghistory/article/view/391