
Data tells a story, but one that is shaped by a myriad of decisions made by humans during its collection and processing. Like nearly every dataset, Desert Island Disks (Finnegan et al., 2021) has empty fields, errors, ambiguous data, and edge cases; I was interested in illuminating the story of the state the dataset came in to convey that data, as Johanna Drucker put it, is “taken not given, constructed as an interpretation of the phenomenal world, not inherent in it” (Drucker, 2011). Inspired by the work of Mimi Onuoha, whose art installation The Library of Missing Datasets (2016) draws attention to the absence of datasets and the choice made about what is “present and centered”(Onuoha, 2016), I aimed to draw attention to the incompleteness and imperfections of Desert Island Disks while alluding to the efficacy of data collection, the limits of our digital tools, and drawing attention to the unstable foundations of digital scholarship, while spotlighting the extent of human intervention needed in computational processing.
Knowledge acquisition occurs differently when information is conveyed in different modes and combinations thereof. Institutional pedagogy such as that found in higher education often emphasizes what W. F. Umi Hsu refers to as the “silence of learning,” helping codify the rank of learning modalities which privileges “writing and printed text over auditory processes such as listening, speaking, discussing, making, and collective brainstorming.” (Hsu, 2018, p. 131). At the same, time, in the Digital Humanities, there is an acknowledged overemphasis on visualizations—network graphs, StoryMaps, and infographics, for example. In addition, scholars have described a disconnection between the computational processes and the human perceptual experience which in turn, effects our comprehension (Bleeker, et al, 2020, p.1089). This has led many scholars and artists to make “data objects”—physical/material representations of data that both “mediate and produce knowledge” creating a “relationship between the sensory affordances of these objects and how they become part of practices of knowing” (Bleeker et al., 2020, p. 1090).
The Sound of Age on Sonic Pi: sample
The Sounds of Age is an experiment in alternative modes of data representation that teach data literacy and facilitate knowledge acquisition of the data. The thrust of the project is to create an experience of the data that activates senses other than sight. I chose to represent the age of every castaway/guest at the time their episode aired. By transposing a section of our source material into an experiential mode, the audience can interpret and understand data with minimal explanation. Sonification was a natural fit for these goals.
Sonification
Sonifcation is the “practice of mapping aspects of the data to produce sound signals” and, Shawn Graham argues, it must meet certain criteria including reproducibility and intelligibility (Graham, 2016). The Sounds of Age takes advantage of the time-based, linear facet of a piece of music and transposes the age of the program’s “castaways” on the day of their episode so that it can be played on an 88-key piano. Higher and lower values/ages are easily coded by pitch (higher notes for younger guests, lower notes for older), chords can indicate edge cases or errors (i.e. episodes where there was more than one guest and/or when the computational process produced errors), and absences can be coded as rests, clearly understood when juxtaposed played notes. The simplicity of the transposition is purposeful and experimenting with this subset of data can exemplify the potential for data sonification in knowledge acquisition. As Last and Usyskin found, even to “untrained listeners (listeners with no formal training in music)” sonification can “make useful distinctions in the data”; they found listeners could discriminate in the sonified data common data exploration tasks such as classification and clustering” (Graham, 2016). Furthermore, with this kind of sonification, the data can also exist in the form of sheet music and played.
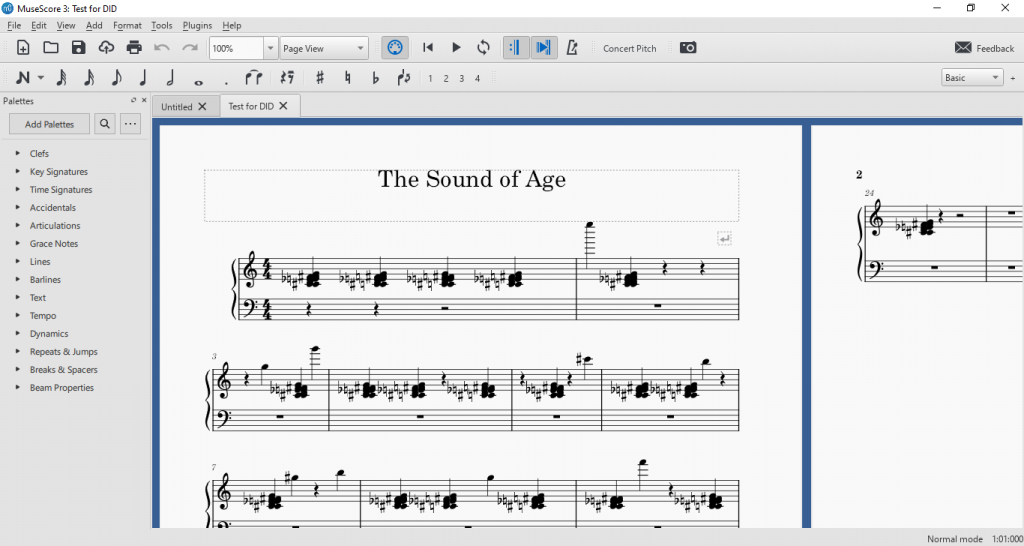
The Sound of Age on Sonic Pi: from the beginning
Play
The act of playing music is interactive; the performance allows the performer a dynamic way of learning the parameters of a set of values. Although it’s not a “genuine physiological sensory capacity”, it engages the senses and “’helps us understand how things work’ independently from language as an intermediary… [which] generate[s] new knowledge or new insights into seemingly familiar phenomena.” (Bleeker et al., 2020, p. 1101). Having sheet music allows for a kind of interactive experience where the act of playing would allow the performer to understand the parameters of the composition and by extension, the data. Through this modality, more senses are engaged in the knowledge acquisition and the simplicity of the coding can be played with in order to create new knowledge.
Listen and Learn
Below are clips of the beginning of each decade Desert Island Discs has been on the air (the program went off the air in 1946 to 1951). What do you hear?
The Sound of Age on Sonic Pi: The beginning of 1951
The Sound of Age on Sonic Pi: The beginning of 1960
The Sound of Age on Sonic Pi: The beginning of 1970
The Sound of Age on Sonic Pi: The beginning of 1980
The Sound of Age on Sonic Pi: The beginning of 1990
The Sound of Age on Sonic Pi: The beginning of 2000
The Sound of Age on Sonic Pi: The beginning of 2010
The Sound of Age on Sonic Pi: The beginning of 2020
Documentation
My use of the Desert Island Disks (Finnegan et al., 2021) was driven by a desire to do as little data processing as possible in order to have the sonification accurately reflect the state of the dataset when we found it. I used a portion of the “castaways” sheet which is sorted chronologically by episode number/date the episode aired: date (date of episode), name, and date_of_birth. Working in Excel, the castaways were sorted to identify:
- Duplicates that were not additional appearances (several guests have appeared on the program multiple times and their ages are be included in sequence, however five episodes were duplicated and omitted: Sir Osbert Lancaster – 1955-02-17; Sir Arthur Bliss – 1959-11-09; Sir Arthur Bliss – 1972-07-31; Sir Osbert Lancaster – 1979-12-28; Sir Ralph Richardson – 1983-12-27)
- Episodes where there was more than one castaway (most often as a pair) in order to separate the guests and add date of birth information manually; this happened 24 times
The data in date [of episode] and date_of_birth came formatted as YYYY-MM-DD text which Excel does not register as a date, and simply using the Format> Date function in Excel did not transform the data, so a formula was applied to change both columns first into integers which can be transformed into a formatted date: =VALUE(cell). Where the date of birth was prior to 1900, Excel did not register the value as a date and returned #VALUE! Instead of the correctly formatted date.
Once the date and date_of_birth columns were transformed into formatted dates, a simple formula was used to calculate the castaway’s age at the time the episode aired: =DATEDIF(F2,D2, “y”) where F was date_of_birth, D was date [of episode], and “y” returns the calculation in years (i.e. age).
This rendered three types of age values:
- A whole number indicating the castaway’s age at the time the episode aired
- #VALUE! error where the date of birth was #VALUE! and therefore the age calculation could not be completed
- Null or an empty cell where the date_of_birth was empty in the original dataset and therefore the age calculation could not be completed
Of the ages that could be returned, the youngest castaway was Quentin Poole (aged 13; date of episode: 28 December 1970) and the oldest castaway was Harry Rabinowitz (aged 99; date of episode: 3 July 2015).
The range from 13 to 99 (inclusive) is 87 which is easy enough to map on a piano with 88 keys. I just eliminated the lowest note on the keyboard. The age values were transposed with the following conditions:
- Younger ages are higher notes, older are lower
- Where there was more than one guest and the date_of_birth had an entry, the other castaway birthdays were manually found (mostly sourced via Wikipedia), and played together as a chord; if they are the same, distinguish in some other way (e.g. play note louder or staccato, longer or trill with the note above)
- Where there was no date_of_birth and an age could not be calculated, that castaway is a rest
- Where the age was the #VALUE! error, a special 8-key chord would play to distinguish itself clearly from
- When there is more than one guest, play the two years together; if they are the same age, play the age and trill with the note above
My initial intention was to get the data into MuseScore (MuseScore, 2021), a free and open-source composition software, so that I could manipulate the musical phrasing, instrumentation, or composition as well as generate an audio file and sheet music to be played in future. MuseScore can import a midi file, so I tried a test of converting the first 10 ages into a csv format that could be converted into a midi file. Unfortunately, my converter tools were not returning the correct output, however, the idea to import a midi file informed how the age was transposed; in midi, Middle C on the piano is the value 60, every half tone higher is a whole number higher (i.e. Middle C# is 61, D is 62, etc.) and every half down lower is a whole number lower (i.e. B is 59, B flat is 58, etc.). I was able to do the transposition in Excel by sorting the age column and entering in bulk the transposition value; I also used Find and Replace to transpose the rest and error chord.
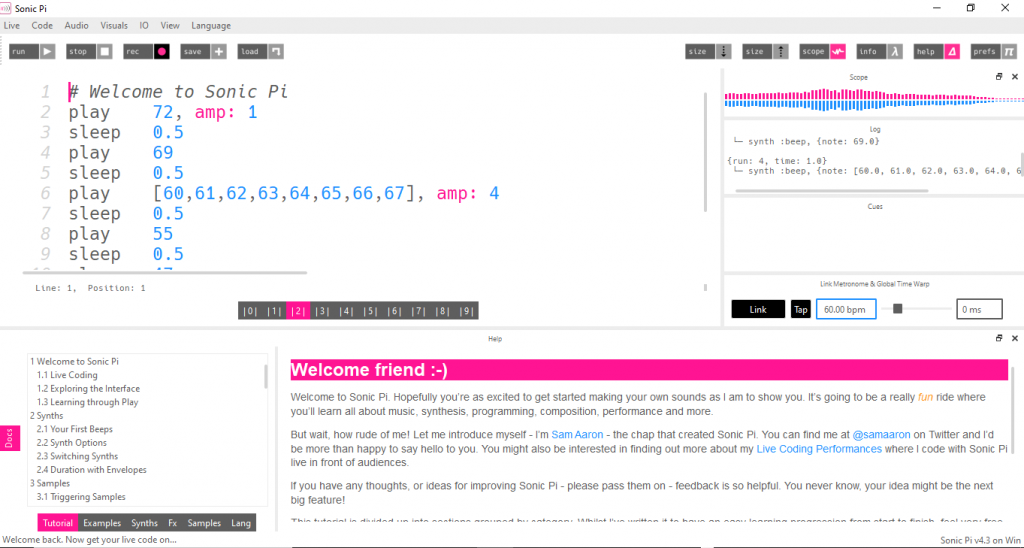
When I failed to convert my test CSV to midi, I found Sonic Pi, a free and open source live coding sonification tool (Aaron, 2022). It also uses the midi piano key values and chords appear as a list of values. Similar to midi, it requires instruction on when to play and when to stop playing a note, so for every instance (note/rest/chord) needs two lines of code. For example:
- play 72, amp: 1 means to play a certain note (72) at a volume (amp) above or below the default.
- sleep 0.5 indicates how long the previous line should be played. In this instance, the time signature is 4/4 and the beats per minute (bpm) is set to 60. So sleep 0.5 means each beat is half a second.
- play [60,61,62,63,64,65,66,67], amp: 2 is the musical equivalent to an error in the age information where all of those notes are played together as a loud chord.
Not shown here is play :r which means to play a rest instead of a note.
Much of this coding could be input using Find and Replace all in Excel (for the error chord and rests) and using the Sort function to add the sleep code.
Sonic Pi is a powerful and easy-to-use tool which can output an mp3, but it doesn’t generate sheet music. It also has a limit to the number of lines each “buffer” can handle, so the entire Sound of Age data exists across six panels and generated six mp3s that can play in sequence in a playlist.
Next Steps
Sonic Pi does not generate sheet music, so the above sample was manually input using an AKAI MPK mini and MuseScore. Next steps would be to explore the use of Python to complete translate the Sonic Pi code to a midi file that MuseScore can read to generate a single audio file and the full sheet music. Once in MuseScore, it might also be possible to change the configuration of the score to test comprehension and knowledge acquisition. For instance, one could try isolating particular decades in time and assigning different instrumentation to different decades to be played together; the juxtaposition may be a confusing auditory experience, or it might not. Either way, new relationship would emerge and potentially alter the knowledge acquisition inherent in the sheet music and sonification.
– Carol Choi