On 3/11/19, I attended the closing night of a very interesting exhibition called Data Through Design at the Brooklyn Navy Yard. This annual alternative cartography exhibition is held during New York City’s Open Data Week, and is an endeavor of the Mayor’s Office of Data Analytics. The objective of this exhibit is to enable curious makers such as technologist, artists, and designers to create novel methods of map-making, present new narrative perspectives, and develop a deeper understanding of life in the city using data as a medium. [DataThroughDesign, 2019] The closing night of this exhibit consisted of tour of the artwork, a chat with the artists, and a panel discussion between the organizers and the artist on their work.
One of the things that intrigued me about this exhibit was how they challenged the way we interpret and process data and how it can be express or communicated through art. The theme is designed to challenge artists to consider how to tell the hidden stories and the connections that can be made through data. The theme this year was “Not a Number”. According to Wikipedia, in computers, Not a Number (NaN), is a numeric data type value representing an undefined or unpresentable value. [Wikipedia, 2019]
Organizers of Design Through Data, brought together a total of 16 artist working on 9 different projects, each team or artist were tasked with using NYC’s open data (https://opendata.cityofnewyork.us) to create their art under the Not a Number (NaN) theme. They are essentially telling stories through art with the free public data published by New York City agencies and other partners. Each artist utilized the public data and effectively expressed it visual and/or aural by communicating and telling a story that fits the Not a Number theme.
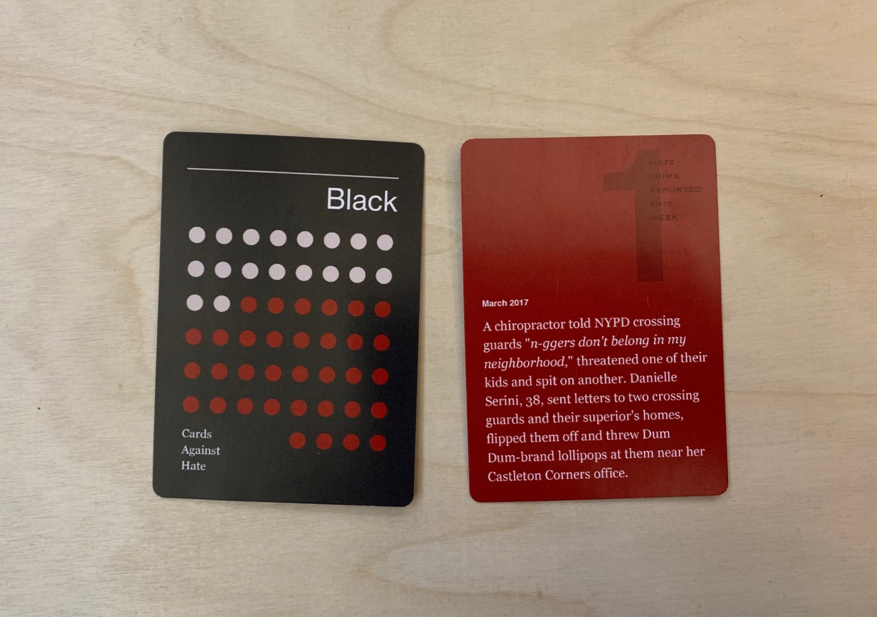
During the artist chat and panel discussion it was interesting to see and hear how they brought the data to life with their tangible and interactive art. I found the data, content, and art of one project to be particularly interesting. It was called Cards Against Hate, created by Stephannie Luu and Andrew Lin. This project was a deck of cards (52 cards total) that focused on a specific demographic/group and hate crimes committed against them over the course of a year. So there are approx. 52 weeks in a year, so each card detailed a hate crime that happened during that week.
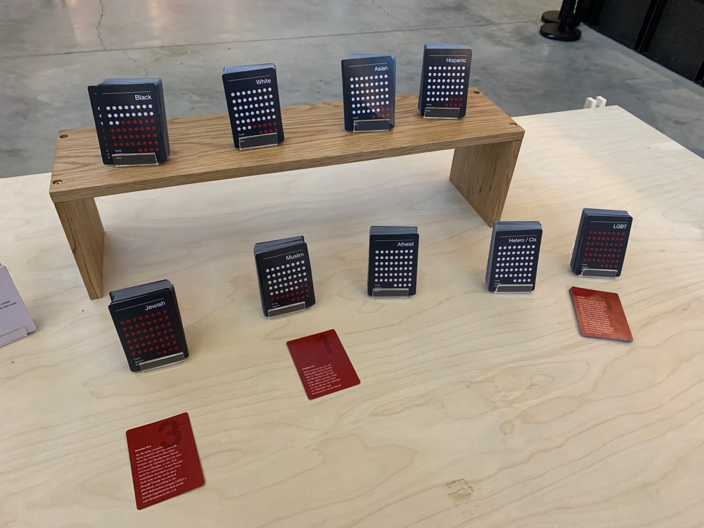
It’s a play on the popular and somewhat controversial party game, Cards Against Humanity, in which players complete fill-in-the blank statements using playing cards with words or phrases that are offensive or politically incorrect. Of course this project isn’t meant to be played as a game or in a light hearted way, instead it is a heavy and in your face deck of cards that places you in the shoes of a specific group and hits you with the realities they face every day of their life.
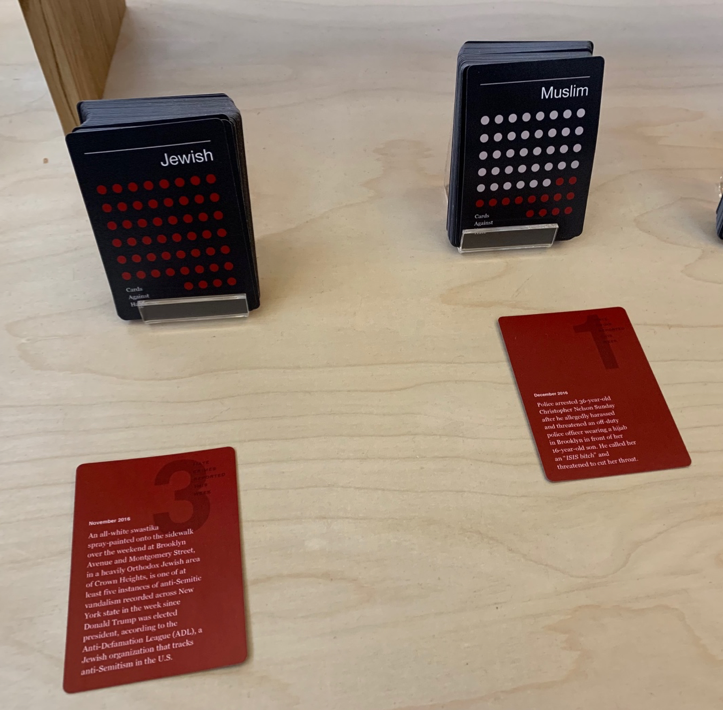
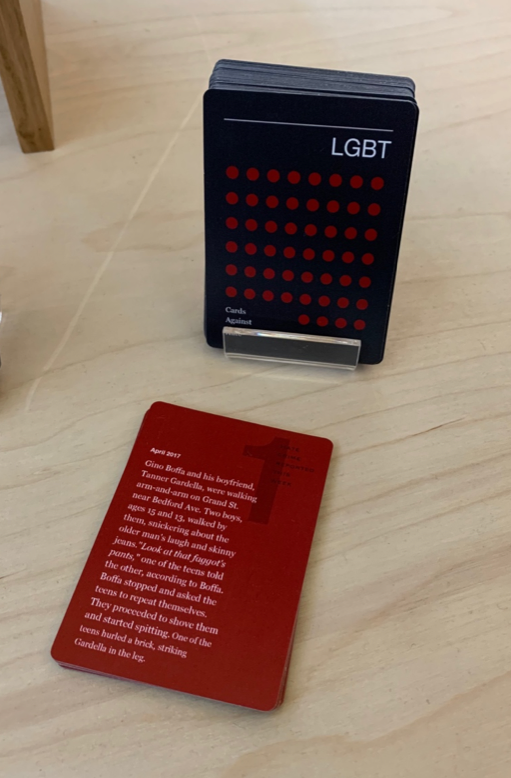
Sadly it wasn’t hard for the artist to find enough data to create not only one deck of cards but several decks for various demographics such as members of African Americans, Caucasian, Asian, Hispanic, Muslims, Jewish, and LGBT groups. It was also interesting to hear how data is constantly being misused today, especially in this era of “fake news”. During the Artist Chat, one of the Co-Creator of Cards Against Hate commented on this by saying “It wasn’t hard to find articles misusing this information [hate crime data]. Not all data is perfect, especially if not used in the right way.”
The creators mention one of the motivations while compiling and creating Humans Against Hate was centered around making data/statistics accessible and consumable. They said, “The emotions and human experience was important to us. Representing it in this way makes it real and tangible as opposed to looking at numeric numbers and statistics in a database”
I thoroughly enjoed this exhibit as it brought to life statistical/numerical data to life. It also reinforced the principles and theories we’ve learned in class as this exhibit and the artist projects are great examples of Michael Buckland’s three meanings of Information: information-as-process, information-as-knowledge, and information-as-thing. As mentioned by Buckland, An exploration of “information” runs into immediate difficulties since information has to do with becoming informed, with the reduction of ignorance and of uncertainty, it is ironic that the term “information” is itself ambiguous and used in different ways. [Buckland, 1991]
Brief definitions of each are below:
- Information-as-process is the act of informing or being informed
- Information-as-knowledge is the knowledge communicated, perceived, or gained in information-as process.
- Information-as-thing is the objects we use to provide information i.e. objects that are considered informative.
If we take the “Cards Against Hate” project by Stephannie Luu and Andrew Lin, you can easily see how it fits Bucklands definition of information. For instance, the entire project itself is information-as-process as it is informing through art, the information collectively gathered via NYC open data (statistical information, various dates/details of hate crimes) is information as knowledge, and finally the deck of cards themselves represent information-as-thing.
Moreover the NYC Open data repository is a collection of (free) information based on real data collected by various agency’s and supports Buckland’s definition on evidence. “Evidence” is an appropriate term because it denotes something related to understanding, something which, if found and correctly understood, could change one’s knowledge, one’s beliefs, concerning some matter. [Buckland, 1991]. This collection of “evidence” along with the 3 definitions of information provide context to the data for hate crimes committed against various demographic groups and make the deck and other artwork extremely effective. Without this context it would be hard to understand or interpreting information being presented.
This was a great and informative exhibit! I thoroughly enjoyed hearing the artist process and perspective during the chat/panel discussions, and what I learned from the art they made. It opened my eyes on the impact of not only data but art as well. I’m looking forward to attending this exhibit in the future and excited to see what the coordinators and artist bring to life with their projects/art.
References
DataThroughDesign, About Data Through Design. Available online: http://2019.datathroughdesign.com/about[Accessed on March 15, 2019]
Wikipedia, NaN – Not a Number, available online: https://en.wikipedia.org/wiki/NaN[Accessed on March 15, 2019]
Buckland, Michael. “Information as Thing”, June 1991. Journal of the American Society for Information Science 42:5: 351-360.