Background and Research
This map serves as an introduction to spatial analysis for a larger research project examining how socioeconomic factors might have impacted geographies of trash in New York City from 2017 to the present. In this map, I visualize the location of 311 trash-related complaints alongside a current map of litter baskets in Brooklyn to examine which spatial patterns, if any, emerge.
Methodology and Visualization
I used two datasets from NYC OpenData for this visualization. The first is the “311 Service Requests from 2010 to Present,” filtered for the conditions explained above. I also used the “DSNY Litter Basket Inventory” shape file, filtered to show only litter baskets in Brooklyn.
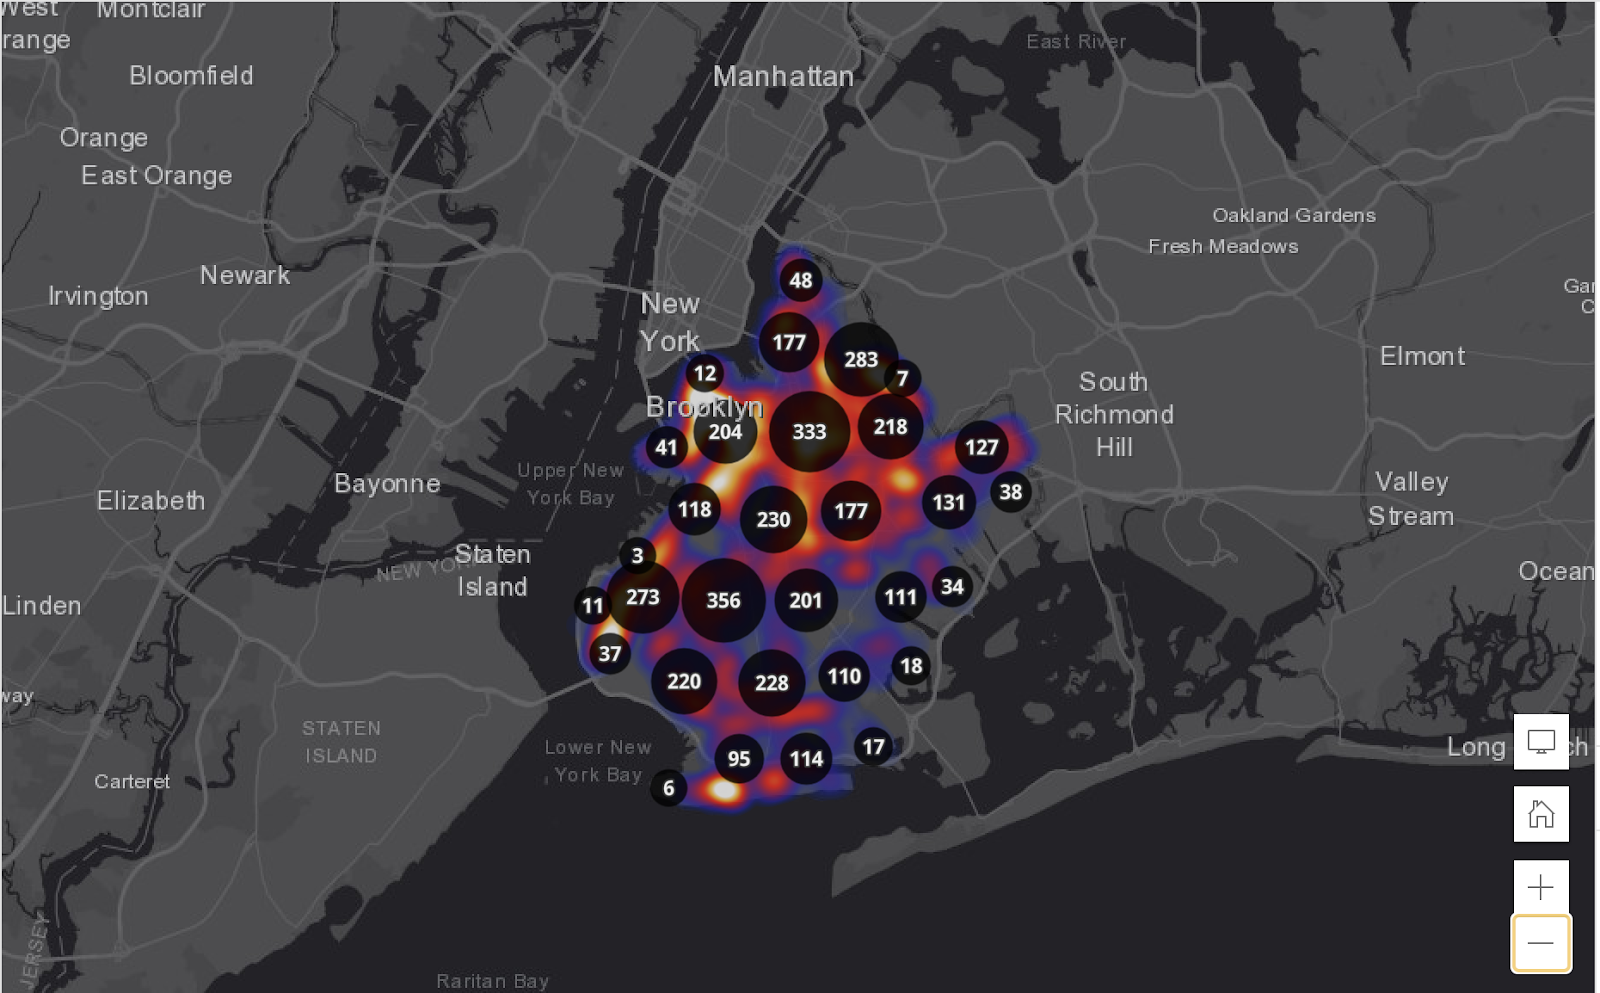
I used ArcGIS to create the attached map. Because both datasets contained point data, I did not want to overwhelm the map with a large number of dots competing for user attention. Instead, I visualized the litter basket point data as a heat map in order to more simply show areas with a high concentration of litter baskets. These areas appear brighter and lighter than the darker, purple-blue sections that indicate a lower concentration of baskets. To make the heat map more legible, I used the dark basemap. To visualize the large number of 311 trash-related complaints, I aggregated the data within ArcGIS into clusters so that various data points would display as one symbol. Because the clusters are proportionally sized, the concentration of 311 complaints is easily legible. The clusters are also labeled and change dynamically as users navigate through the map. I chose to use black semi-transparent circles so that the clusters would easily stand out against the glowing background of the heatmap feature layer.
Analysis and Future Work
Spatially, nearly all litter baskets are placed along long streets, though areas of downtown Brooklyn appear to have a greater concentration of baskets along smaller streets running across and parallel to longer streets. Southeastern Brooklyn seems to have a smaller concentration of litter baskets than other parts of the borough, with downtown Brooklyn having the highest. The areas with the highest concentration of 311 complaints appear to be areas with a lower concentration of litter baskets. Some areas, on the other hand, have a low concentration of both complaints and baskets.

Aside from expanding the project into what I have explained in my introduction, It would be helpful to run statistical analyses to further examine the relationship between litter baskets and complaints about trash. Further work could also look into the different trash-related complaint types within the 311 dataset and see how different ones relate to inventory. Lastly, it would be interesting to visualize 311 responses spatially to examine any patterns that emerge.
Explore the map here!