
Introduction
The National Hockey League (NHL) began organized play in 1917 with four teams. Today, there are 31 teams, soon to be 32, spread across two countries and 3 separate time zones throughout North America. Although time, rules, and new technology have changed the game, the goal has always remained the same – win.
The way team owners, managers, and coaches evaluated players that would lead them to win games, and eventually, a Stanley Cup, has continually changed over the 100+ years of the NHL’s existence. In the beginning, the thought was pretty simple on how to predict a win for a team – acquire the players who could score the most goals. With the advent of stronger shot tracking technology, teams have turned to analyze statistics that count the shots a player takes while on the ice and compare them to the shots they allow on their own goalie.
The game is incredibly faster than it was 100 years ago, even 20 years ago. It’s up to a team’s ownership and management to find the right analytics on players that can predict a higher likelihood of obtaining that overall goal – a win.
Inspiration
When I was 5 years old, my father turned on a Philadelphia Flyers game. I dropped everything I was doing, plopped myself in front of the screen, and watched enticingly as the puck and players danced across the ice. It was that moment where I would start my hockey career. Hockey has been a driving force that has helped shape my identity. It’s an activity I look forward to watching, playing, and bonding over with friends and teammates.
After playing up through college, it’s been fascinating to see how team managers decide who to put on the ice during a game depending on the situation, score, and time left on the clock. Analytics has always had a battle with sports involving its integration. Like in the movie Moneyball, players, managers, and fans of the game argue over whether or not analytics is the silver bullet in effectively predicting a desirable outcome.
When deciding on a topic for this project, I decided to see just how this argument on analytics has played out. Are new models being created in the modern hockey era? What types of statistics were being tracked at the NHL’s conception? These are some of the questions that I hoped to answer by making a timeline.

Methodology
I used Timeline JS to create a visual representation of the player statistics tracked and developed over the course of the NHL’s existence. The tool provided a Google Sheet to organize the data row by row. For each statistic I was able to find, I noted the season it was recorded, a headline title of its name, a short description of it, and an image reflecting its definition. Once the data was placed in the Google Sheet, I would publish it to the Timeline JS tool by clicking “Publish to the Web” under the File menu. After I confirmed the sheet was published, I took the URL of the Google Sheet and pasted it into a field on the Timeline JS website. A preview of the timeline was shown at the bottom of the homepage but I could also see the timeline in its own window.

For materials, I relied on the NHL.com website where I was able to find out when certain analytics began being officially recorded by The League. For modern-day analytics like Corsi and Fenwick, I had to use Wikipedia to understand the history behind both statistics, those who discovered it, and a description of what it was. I also used hockey-reference.com, a website dedicated to tracking advanced hockey player analytics, to understand which season certain statistics were being recorded.

Conclusion
The modern game doesn’t place as much emphasis or importance on goals scored by each player anymore. A stronger analytic that predicts a win with higher probability is the amount of shots a player takes, the time they spend in the offensive zone, and the amount of offensive opportunities a player thwarts away from his or her opponent. Although a player might score 40 or 50 goals a season, the same player could also allow the same amount of goals against their team while they’re on the ice. It’s important for players today to have a well-rounded resume when it comes to providing offensive pressure and also posing as a strong defensive threat.
Reflection
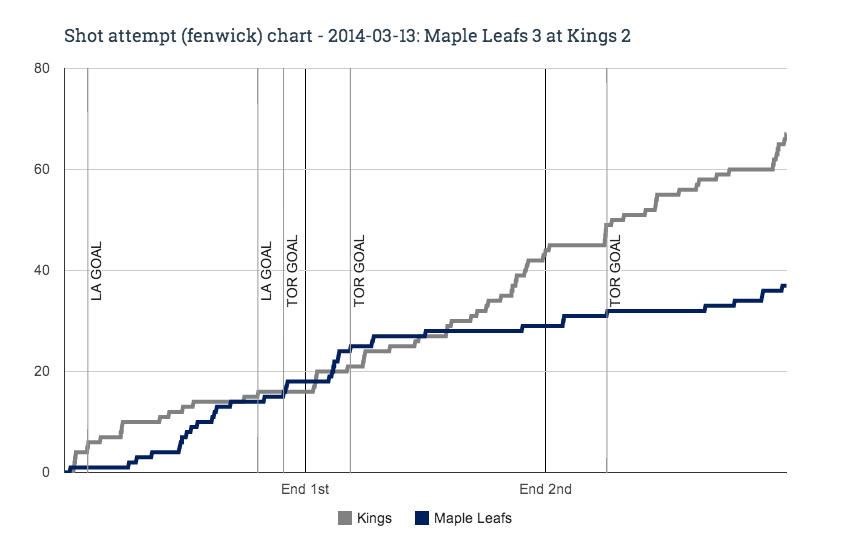
During my peer review, a major finding that was brought up was the difference between Corsi and Fenwick analytics. There has been a major debate amongst hockey analysts today on which one is more important. Corsi is the score a player receives depending on the amount of shots they have or allow on an opposing goaltender versus the amount of shots they allow on their own goaltender. This statistic takes into account shots taken, missed, and even blocked. The Fenwick analytic takes the same approach but instead does not include blocked shot attempts.
Those who are pro-Fenwick argue that a shot blocked by a player should not be counted against them for their overall impact when on the ice. On the other hand, pro-Corsi analysts argue that a shot attempted is an offensive opportunity and a player should thwart that attempt before a shot is taken. It’s tough to include more details on the argument between Corsi and Fenwick on this timeline. However, this could constitute another project on the historical perspective of hockey analytics.
Another finding that came up during my peer review meeting was the definition of certain terms that might not be immediately known to someone who isn’t familiar with hockey. For example, faceoffs, an action where two players battle for the puck after a stoppage in play, is not a well-known term. Also, the way special teams operate in a hockey game is much different than a more familiar sport like football. Special teams in hockey are groups of players who play during a 5v4, 4v4, 4v3, or 5v3 play when there are a number of players taking a penalty. These terms are important to understand when deciphering the timeline. Therefore, before submitting this project, I took the time to explain the specifics surrounding the unknown terms pointed out in my peer review.

There will constantly be analysts coming from all types of industries trying to bring their expertise and models that may help predict desirable outcomes for a hockey game. However, there is no clear causal relationship between these analytics as of yet. Sometimes, a goalie might stop every shot you throw at them. Sometimes a team might let a fairly low amount of shots on their own goalie and just one happens to unluckily bounce in. The game will continue to be a balance of analytics, good fortune, and gut feeling.
Sources
1933-34 Season (Special Teams)