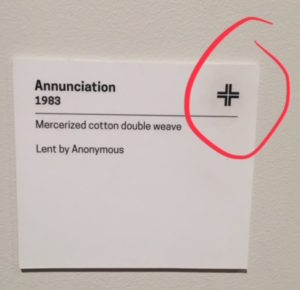
I visited the Cooper-Hewitt Design Museum to observe their “digital pen” project. Like all visitors, I was offered the pen to use for the duration of my visit in the same way many museums offer audio guides. The museum staff explained that touching the pen to a symbol on an object’s wall will save the object to a digital collection I could later retrieve on the museum’s website. The staff then handed me a ticket stub with a printed code. I would need the code to access my collection
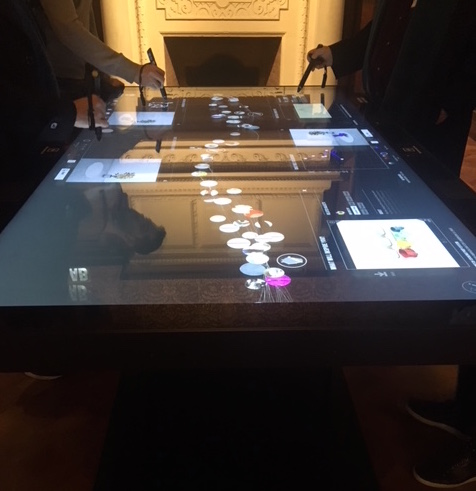
For three hours I walked through every gallery of the museum, observing how visitors were making use of their pens. I watched as visitors gathered around dining-room sized tables scattered throughout the galleries. They were using the pens to create designs on the tables’ interactive screens.
I noticed a visitor struggling to use her pen on a wall label. A guard attempted to demonstrate its proper use. He struggled with the pen himself a bit and commented “These things can have a mind of their own. Sometimes it works and sometimes it doesn’t.” With assistance from the guard, the woman was finally able to save her object. The pen gave a satisfying vibration and flashed green lights to indicate successful contact. The woman then raised the pen to her ear. The guard told her “No, it’s in cyberspace. You can share your collection with a friend. Don’t lose your ticket.” I watched the woman wander into another gallery with her pen dangling from the cord on her wrist. She started taking photos with her phone. I asked the guard if people often asked for help with the pens. He replied “One hundred times a day!”
Another visitor tried to save every item along one wall. I watched as one after another, she went to each item’s label and tried out a jab-and-slide technique with a confused expression. I imagined her telling herself “it’s all in the wrist.” It was like watching a tourist re-swiping their subway card. I figured once you get it, it’s in your muscle memory.
Some visitors seemed to have mastered the object-saving usage of the pen. I observed two men saving items with ease. One of them, however, touched his pen on a waist high screen where a video was playing. A guard then intervened, letting him know that that particular screen was just a regular video and was not for meant for the pens. I could see how a visitor would make the mistake with so many interactive digital screens around.
Throughout my visit, I estimate that around half of visitors were at least trying out the pens. The other half of visitors were using their phones to capture objects and wall text. I watched one gallery for fifteen minutes. During that time, many people were twirling their pens by their cord but taking photos with their phones.
I turned my attention to the numerous digital tables throughout the galleries and watched as visitors experimented with the pens. A constant stream of images runs along the length of the rectangular screens. I watched on as a museum staff member giving a tour called the random floating images the “river of objects.” She explained that the museum has 200,000 objects in their collection but they focused on 4,000 for the river. From my estimation, there seemed to be around 100 or so images, based on the rate at which the same objects would loop through in the stream. The staff member demonstrated how you could swipe an object out of the river with a pen or finger and examine it more closely. You could then read interpretive text about the object or use the object as an inspiration for a digital design of your own.
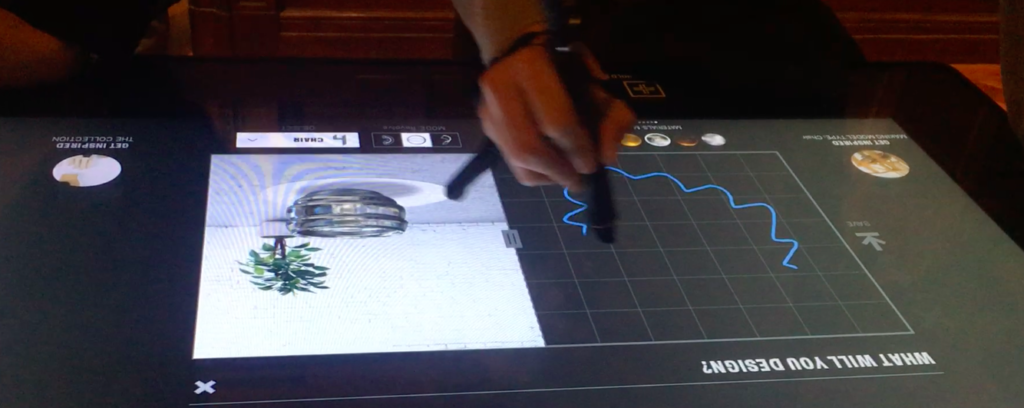
Some visitors were using their pens to make gestural strokes on the screen. Images of objects from the museum’s collection would appear on the screen highlighting how the visitors line is echoed in a an object’s contour or design element. In my observations of the digital tables, I noticed that visitors spent the least amount of time on the gesture line exercise. The novelty of it seemed to dissipate quickly.
From my observation of visitors at the interactive tables, sessions lasted from a few seconds to about ten minutes. Visitors who created their own designs did not seem to be deliberate in their engagement. It was as if they were idly exploring the tool in free-form experimentation.
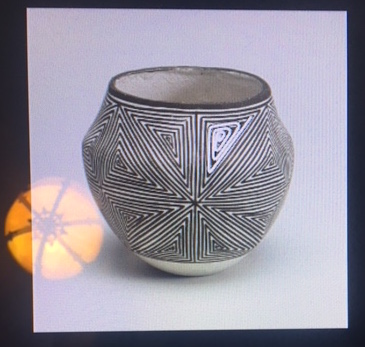
I observed several visitors loading their saved collection onto the touch screen and exploring their objects in more detail. There were multiple views, curatorial text and a scrolling bar of similar objects based on categories as varied as color, movement, and subject matter. There was no way to search for typical tombstone data like artist name, movement, object name, etc. From what I could tell, the tables did not include any typing functionality at all. The experience was gesture-oriented.
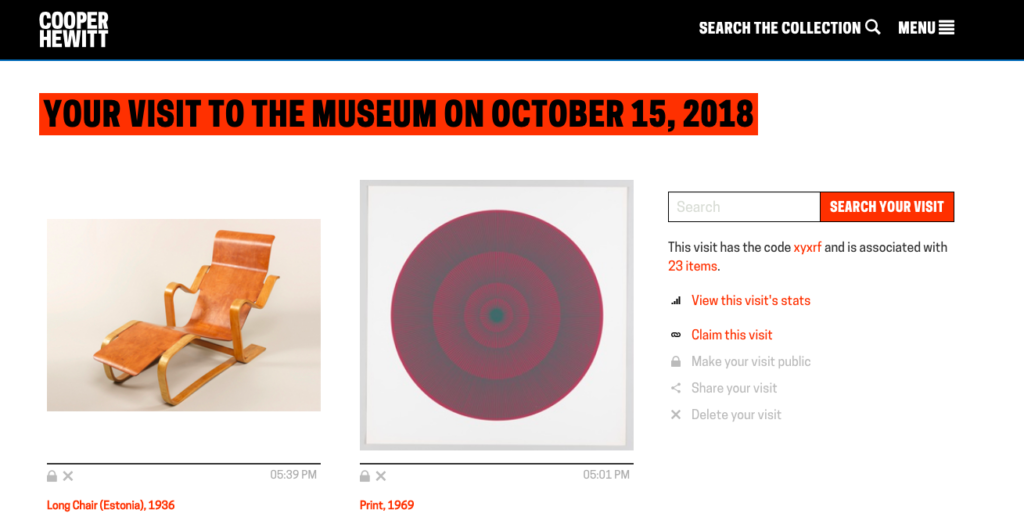
During my visit, I used the pen to assemble my own collection of objects. The museum website has a link to “retrieve your visit.” I could view most of the images I collected, although some objects that were registered by the pen were missing.
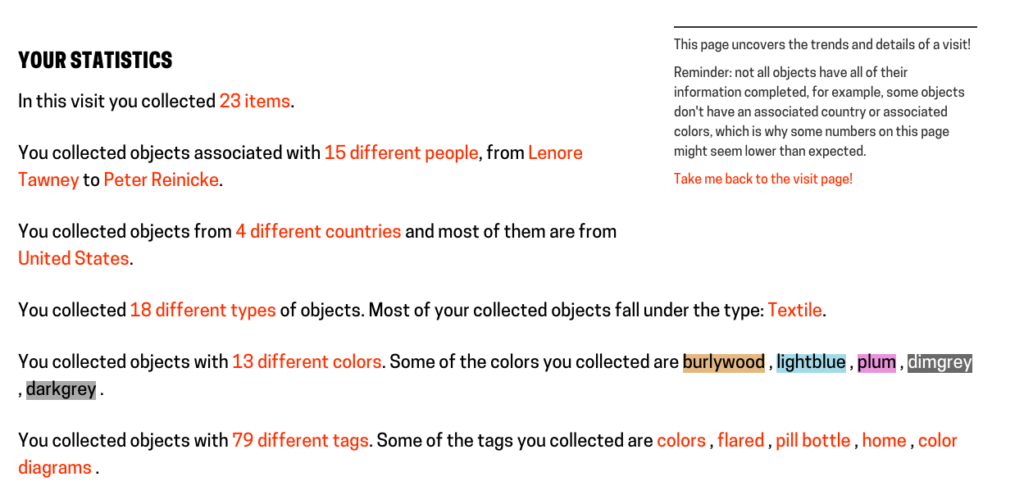
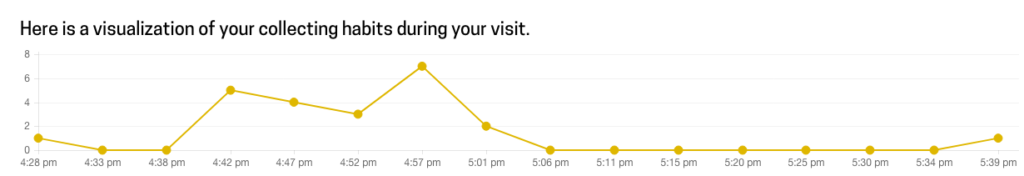
The website portal also allowed me to view stats on my “collecting habits” during my visit. To me, this information resembled the intrusiveness of big data. I thought of the tracking of my internet habits that are used to sell me products. I could find no particular value in the data they were tracking on me. The stats, if anything, seemed more useful for the museum’s own data on how visitors move through exhibitions.
The digital pen is certainly forward-thinking in the way that it recontextualizes a museum collection and redefines the gallery space as a creative zone for the visitor. In theory, it is in keeping with the predictions of Joe Touch, the director at the University of Southern California’s Information Sciences Institute:
The Internet will shift from the place we find cat videos to a background capability that will be a seamless part of how we live our everyday lives. We won’t think about ‘going online’ or ‘looking on the Internet’ for something — we’ll just be online, and just look. (Digital Life in 2025)
However, the pen is clunky, even when it works properly. The idea seems to be to incorporate the traditional experience of looking at objects in a museum into our current compulsion for information accrual in the digital realm. But the process introduces too many new physical objects that the visitor must learn how to navigate, and in the proper sequence–carry around an additional device besides your phone, walk away from the artwork to interact with numerous touch screens, and don’t lose your ticket code or your visit will seem inconsequential. The process is far from seamless.
The digital pen is more in line with the predictions made by technologists who foresee the increased role of big data. As Judith Donath, a fellow at Harvard University’s Berkman Center for Internet and Society, puts it, “We’ll have a picture of how someone has spent their time, the depth of their commitment to their hobbies, causes, friends, and family. This will change how we think about people, how we establish trust, how we negotiate change, failure, and success.” (Digital Life in 2025)
There is something futuristic about the digital pen/touch screen experiment. It is the most technologically sophisticated tool for museum visitor experience I have seen. However, its effect is less in line with technologists’ predictions of digital life seamlessly integrated with our physical experience and more in line with technologists’ predictions of big data dictating our actions and behaviors.
Designing the Pen. Retrieved from https://www.cooperhewitt.org/new-experience/designing-pen/
“Digital Life in 2025.” (2014). Pew Research Center. Retrieved from http://assets.pewresearch.org/ wpcontent/uploads/sites/14/2014/03/PIP_Report_Future_of_the_Internet_Predictions_031114.pdf