Field Report: The Whitney Museum of Modern Art

On Friday, April 12th, I attended the Whitney Museum of Modern Art. The Whitney is an eight-floor contemporary art museum located in Manhattan, NY. Their focus is on presenting the full range of twentieth-century and contemporary art with emphasis on living artists. Aside from the exhibitions inside the museum, the building is beautifully designed. It is also located between the highline and the Hudson River. There is a view of the city or the river from any window or terrace. For the purpose of my observation, I was particularly interested on two artworks located on the sixth floor. These artworks seemed to be a combination of technology and art. 

Figure 1: “Baby feat. Kiera” by Ian Cheng

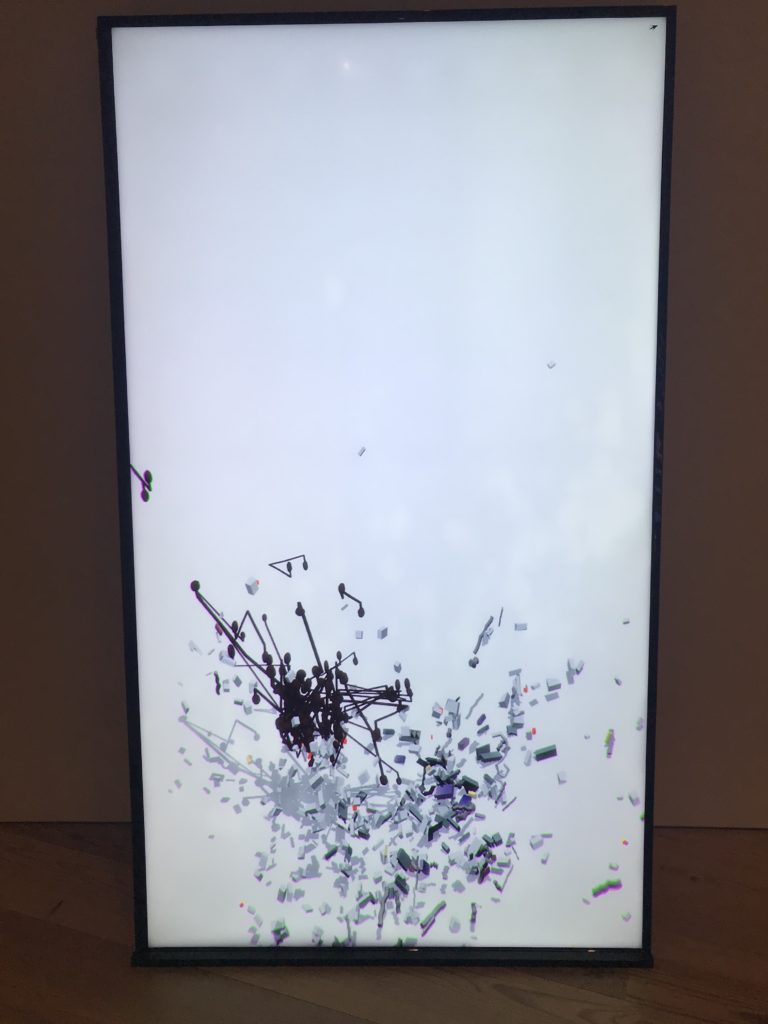
The first piece that I was found interesting was “Baby feat. Kiera” by Ian Cheng (See Fig. 1). In this piece, Cheng’s software enables audible conversation between three online chatbots whose voices then animate a swirl of debris. It does so by using Wi-Fi to query three different customize chatbots from different services to create the impression that they are “talking” to each other. The debris on the screen repeatedly coalesced and disintegrated, exhibits strange patterns on the screen. The chatbots are programmed to be “intelligent,” with basic learning abilities such as expanding their dialogue. However, because this piece queried responses from three different chatbots, the conversation was not cohesive. Instead, it was simply a series of words or sentences that did not have any particular flow. It was interesting to listen to some of thing that were said by these bots because sentences were incredibly complex.

In the article Fundamental Forms of Information, Marcia J. Bates provides a definition of information as being “all the patterns of organization of matter and energy,” which I thought was perfect for this piece due to the eccentric pattern of the debris as well as the incoherent conversation between the chatbots. This piece also prompted me to think of Don Norman and his idea of the human versus computers. In his essay, Being Analog, he says that “human languages still defies complete scientific understanding,” which I feel can be both supported and opposed by this piece. The chatbots in “Baby feat. Kiera” are programmed to be able respond to humans, learn from their responses, and expand their dialogue because of these responses. I feel that being able to learn from conversation is a humanistic element of conversation, which is emulated here. Moreover, the conversation that they are having is incoherent, representing a very non-human conversation. The visuals along with the audio represent artificial intelligence that is lifelike but also mechanistic, so I feel that the argument could go either way. 

Figure 2: “America’s Go No Talent” by Jonah Brucker-Cohen & Katherine Moriwaki

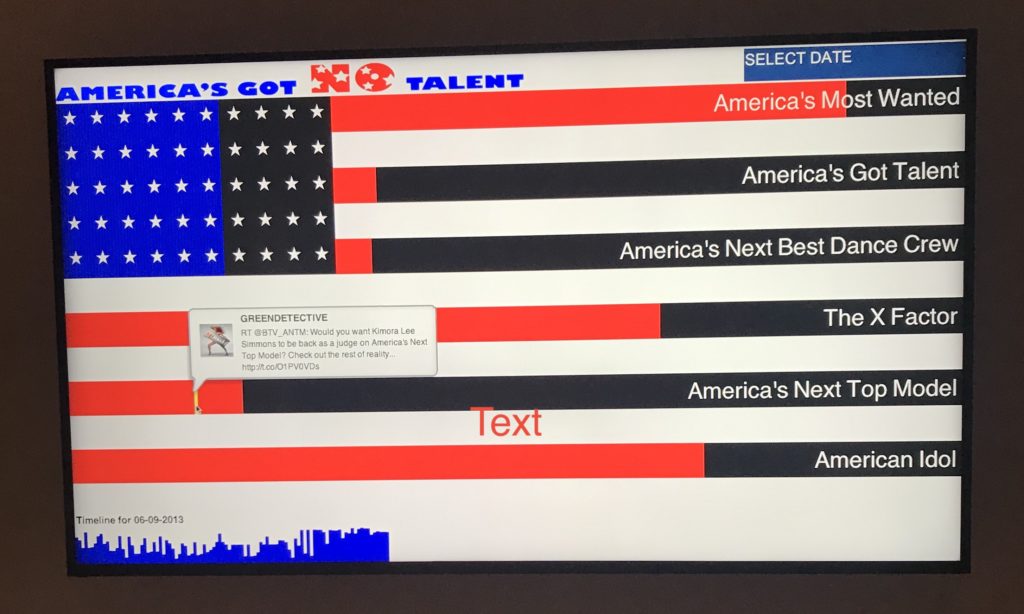
Another piece that I enjoyed was “America’s Got No Talent” by Jonah Brucker-Cohen and Katherine Moriwaki (See Fig. 2). This piece is a data visualization of Twitter feeds related to reality television shows such as American Idol, America’s got Talent, and America’s Best Dance Crew over a few years. The piece displays tweets that were sent and how much bias was gathered for each program based on retweets. By using horizontal bars in the shape of an American Flag, the visualization measures the success of TV shows linked to their social media presence. The artists for this piece successful connect the internet and the TV while clearly demonstrating the effect of a social media presence. 

I feel that this piece was relevant to our conversation on big data and algorithmic culture. I am not entirely sure of the method or tools that were used to make this visualization, but I know that it needs a complex sequence of computational analyses. The tweets that are used in this piece could be defined as “big data” due to the fact that it was a such a large volume of data that was growing exponentially in a short amount of time (“What is Big Data and Why it matters). 

There were several other pieces that incorporated technology as well but I choice to focus on “Baby feat. Kiera” and “America’s Got No Talent” because I found them most interesting. They were also the pieces that I spent the most time interacting with. I spent most of my observation simply observing and trying to understand the different patterns and conversations that were taking place in “Baby feat. Kiera.” I noticed that other museum attendees did not spend nearly as much time as I did with these pieces. Instead, it seems like attendees on this floor weren’t as interested in these pieces as they were pieces on other floors.

References:

Bates, M. J. (2006). Fundamental forms of information. Journal of the American Society for Information Science and Technology,57(8), 1033-1045. doi:10.1002/asi.20369

Norman, D. (2008, November 07). Being Analog. Retrieved April 16, 2019, from https://jnd.org/being_analog/

What is Big Data and why it matters. (n.d.). Retrieved April 16, 2019, from https://www.sas.com/en_us/insights/big-data/what-is-big-data.html

Webinar: How Product Insights uses UserTesting

UserTesting is a platform used to receive rapid customer feedback across different interfaces. UserTesting is most commonly known for remote moderated and unmoderated usability studies. I recently watched a webinar by UserTesting titled “How Product Insights uses UserTesting” which essentially explained how their product insights team uses their own platform to scale research within teams as well as within the entire company. 

The webinar was essentially broken into three points: Data Science & User Experience (UX), access to customers, and enabling others. However, I was particularly interested in the first segment – the relationship between Data Science & User experience (UX). There were several connections to topics that we’ve discussed in class. The speaker, Josh Kunz whom is a senior UX researcher at UserTesting, placed most of the emphasis on User Experience. He explained that they attempt to connect data science and UX research in order to ask and answer impactful questions that ultimately affect the human-centered design. The discussion on this topic touched on research methods, human-computer interactions, and human-centered design.

It was interesting to see the different research approaches that the UserTesting team take, in relation to the methods that we’ve discussed in class. The speaker did not make a clear distinction between qualitative and quantitative research approaches, but it was apparent through his explanations. He elaborated on the UX research process, which greatly resembled the qualitative approach – using interviews and focus groups.  Additionally, he briefly discussed the data science approach which was more of a quantitative approach using statistical modeling, predictions, and algorithms to answer and ask questions. However, it seemed that with the data science approach, this team only analyzed large sets of data that they currently have in their database, closely resembling secondary research, verses collecting and then analyzing data as a primary research. 

During the webinar he walked through a scenario in which UX researchers wanted to see if their perception of how customers used UserTesting matched how customers actually use it. This curiosity came about due to an observation by UX researchers noticing that customers would make copies of tests. As discussed in McGrath’s article, “Methodology Matters: Doing research in the behavioral and social science,” we’ve learned that observations are a qualitative research approach (1995). Data scientist then found out that about 80% of tests are copied with then another 80% of those tests are copied again, which is essentially a vast majority of their customers. Data scientist found this information out through a process of modeling and querying data, closely related to quantitative approaches. The UX researchers then performed both in-person interviews and focus groups with their users to gain an understanding of why customers created these copies. Interviewing and focus groups are another qualitative approach that we’ve both read about and discussed in class (McGrath, 1995). They ultimately found that customers create “chains of tests” which data scientist later ran even more statistical modeling resulting a in visualization that showed how all the tests were related. Finally, the UX researchers then performed another round of interviews which essentially acted as a final set of validations for the previous findings. The switch between UX research and data science is closely related to a mixed methods sequential exploratory design, where one team is essentially collecting data and another team is analyzing or validating it (Creswell & Creswell, 2018).

Ultimately, this research helped UserTesting redesign their interface. This is actually related to another set of topics that we’ve touched upon in class: human-centered design & human-computer interactions. For example, the purpose of this iterative process is to ultimately figure out how the user is actually using the product. As I was watching the webinar, I thought of Wilson’s article, “Human Information Behavior,” in that the focus is not on the system but rather the user (2000). I also feel that this process as a whole pull in principles from human-computer interactions. The research is primarily observing human behavior and analyzing it in relation to the interface to design appropriately. At the end of the speaker’s anecdote, he explained that these findings helped them design with multi-study projects in mind, since this is majority of their audience. Additionally, they also adopted the Google “hearts” frameworks, which was an instrument that I was unfamiliar with.

The Google “hearts” framework does an excellent job marrying UX and data science in that is covers five metrics that both teams are able to measure. These metrics are happiness, engagement, adoption, retention, and task success. Engagement, adoption, and retention are metrics that data scientist are able to measure while UX researchers are able to measure happiness and task success. (Click here for an article that explains the framework more in-depth.)

I thoroughly enjoyed this webinar. I thought that it was really interesting to see how they use their own platform to perform research. I also never really thought that UX research and data science would be highly complementary. It makes sense to think of this as a mixed-methods approach in that the strengths of one team will eliminate the weakness from another. For example, data scientist found that a majority of their customers were creating copies of test, but they would not be able to figure out why they were doing this. The UX team are able to take a most human-centric approach to understand this behavior and actions. I suppose that another distinction that could be made would be to say that data science seems product-centered while UX seems human-centered.

References:

Creswell, J. W., & Creswell, J. D. (2018). Research design: Qualitative, quantitative & mixed methods approaches. Thousand Oaks, CA: SAGE.

Mcgrath, J. E. (1995). METHODOLOGY MATTERS: DOING RESEARCH IN THE BEHAVIORAL and SOCIAL SCIENCES. Readings in Human–Computer Interaction,152-169. doi:10.1016/b978-0-08-051574-8.50019-4

Wilson, T. D. (2000). Human Information Behavior. Informing Science: The International Journal of an Emerging Transdiscipline,3, 049-056. doi:10.28945/576