Project Description
For this project, I created a data visualization dashboard to explore data trends around the VR games being released on the steam platform from 2014 to 2023. I am interested in finding out if the launch of Meta’s (formerly Facebook) VR headsets and the company’s rebranding had an impact on the VR gaming market.
Data Source: Kaggle
Tools: Tableau
Metaverse and VR Gaming
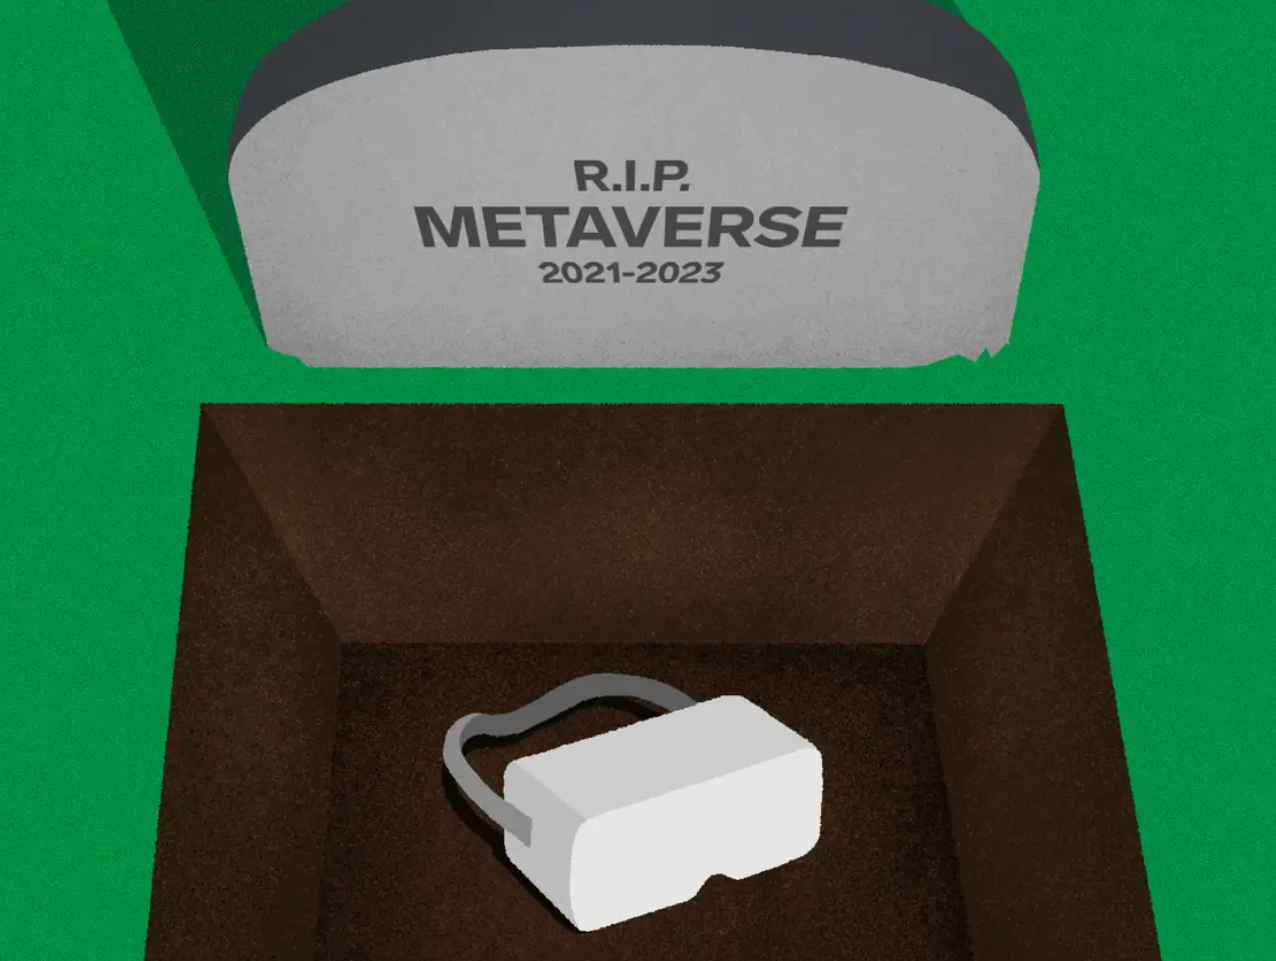
The backdrop to my interest on this topic bagan years ago with Meta’s aggressive push into VR, spearheaded by Mark Zuckerberg. The acquisition of Oculus in 2014 and the subsequent emphasis on VR as the cornerstone of the future metaverse set the stage for what many anticipated to be a transformative era in digital interaction and gaming. The idea that Mark Zuckerberg sold is that now is the time for people to embrase VR technology and integrate it into their daily lives, with the launch of a series of VR quipments, VR games will flourish, Virtual social space will become the place where people hangout. With this idea, other companies have joined the hype around metaverse, launching their own VR-based services or products, and trying to get a foot-hold in the metaverse real-estate that just opened up. Yet, some years later, as a Guardian article named A moment’s silence, please, for the death of Mark Zuckerberg’s metaverse summarized, the hype surrounding the metaverse has, in many ways, fizzled out, leaving behind a trail of unmet expectations and a reevaluation of VR’s place in our digital future.
Exploring data’s side of this story
I thought it would be interesting to see how this story of metaverse’s demise is reflected in data. To answer this question, I turned to an open dataset on Kaggle. This dataset includes all the VR games on the steam platform (Steam is a platform that allows users to buy and download video games made by third-party developers). The data includes important information about each game such as their release date, their gross revenue, their major features, and so on.

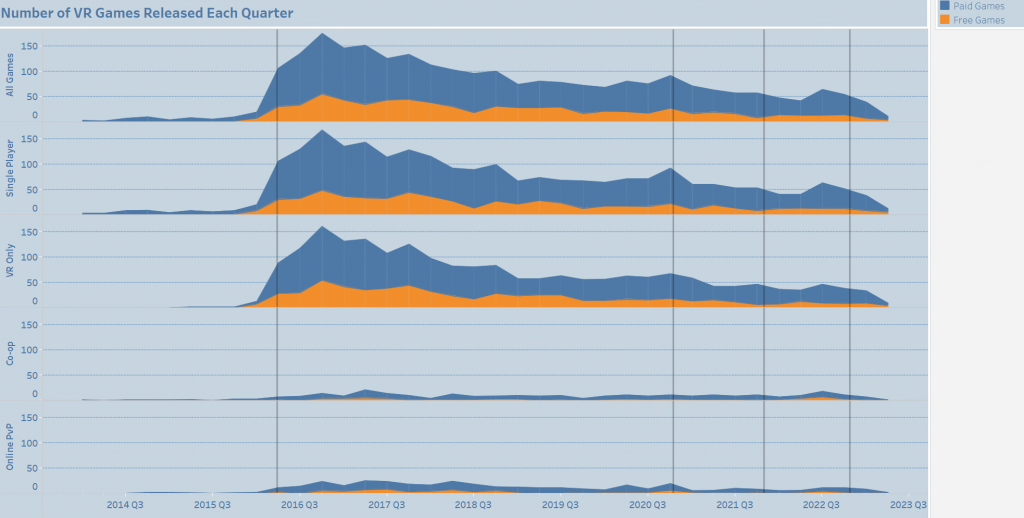
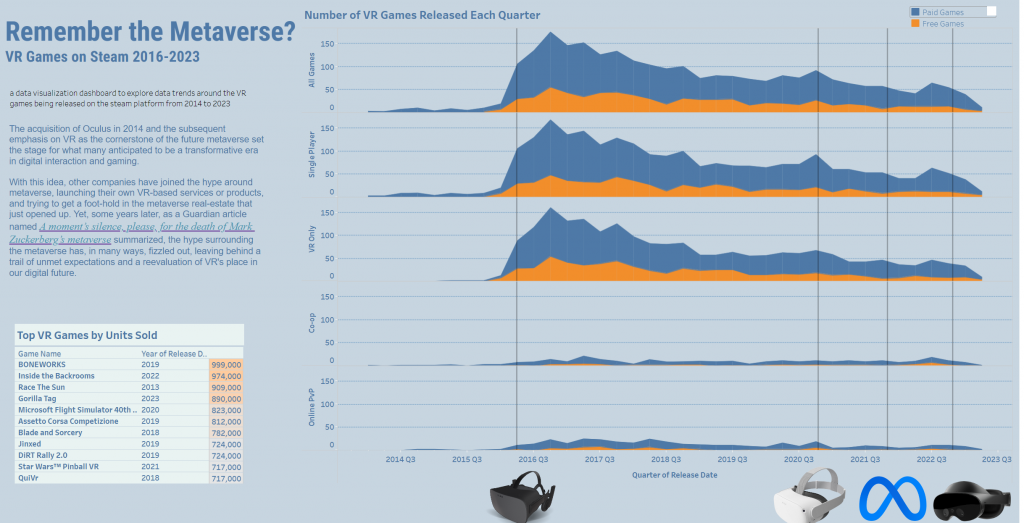
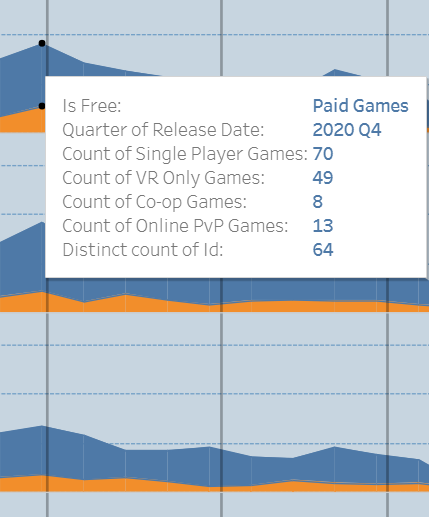
With this data, I was able to create time-based stacked-area charts of each category of VR games from 2014 to 2023, where the total shaded area reflects the number of VR games being released each quarter. The orange shaded area reflects the free games and the blue area reflects the games where users have to purchase. Additionally, I created annotated lines that marked the significant event dates on the time axis, this way, the audience will have an easier time observing how the number of games released to the steam platform changed around each product launch.
Additionally, to explore the other factors at play, I also created a chart showing the top 11 games on the market according to the number of units sold and their release dates.
What the Data Showed:
The data showed a big jump in VR games coming out after the Oculus Rift was launched in 2016. It seemed like VR gaming was taking off, with lots of new games and big sales. But when newer headsets like the Oculus Quest 2 and Meta Quest Pro came out, we didn’t see that same boom. Even though there were a few spikes in game releases, they didn’t last.
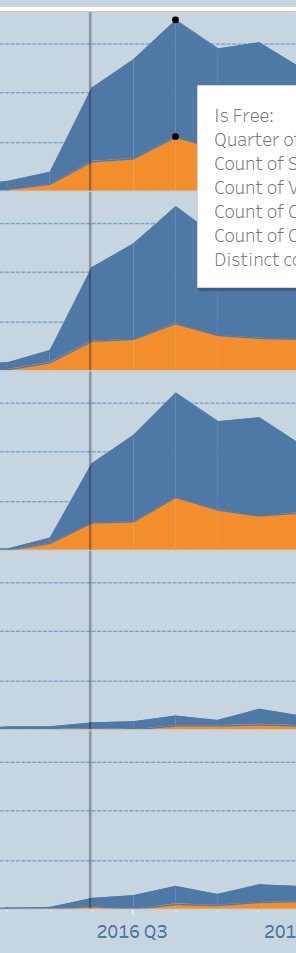
This made me wonder if just making new hardware wasn’t enough to keep the VR gaming world growing. Looking at the leaderboard, it seems like a number of latecomers after 2020 did end up becoming successful VR games on steam. Namely ‘Inside the Backrooms’ and ‘Gorilla Tag’. Interestingly, these are both indie games that first garnered their core users from reddit. These success stories are perhaps what companies like Facebook were anticipating to see en masse once their VR hardware hits the market and people are starting to catch on to the metaverse hype, however, from the data, it seems like most of the VR games released after 2020 have been swept under the rug.
Leave a Reply