NYC School Safety Report – 2010 – 2017
July 24, 2018 - All
This research started with a simple question; I wanted to understand if there was a correlation between school violence, (such as robbery, assault, etc.) plus the violence of regions around schools with the amount of extra-curricular activities that those kids have. In other words, I want to understand if kids have more stuff to do outside schools, crime will be reduced. Based on the fact that those kids are now doing other activities instead of engaging in illegal activities.
The inspiration behind this research came to me while I was reading an article about the reduction of crime percentages over areas that increased the number of hours that kids spent at school in Brazil. That article made me question if that is a valuable truth for other places such as New York City, and then I stater collecting data regarding that subject. My first approach was to analyze how this type of information was displayed n the pass, so I gathered some maps and info from the Brazilian article and some other research regarding the school violence in my home country.

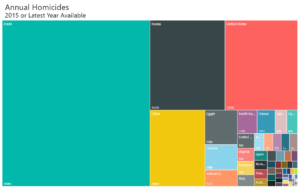
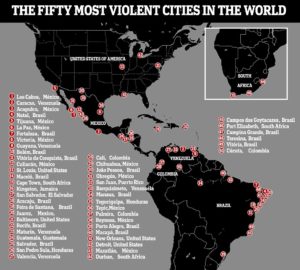
The first one that intrigued me was a map showing the most violent places in the world, and a lot of Brazilian cities were placed really high on the list. That fact itself let me think if the correlation between education and crime was really present, taking the fact that it’s not a rich country and the education levels are not as high as the USA. The second visualization that caught my eye was a list of the countries with most homicides, and again Brazil was on the lead.
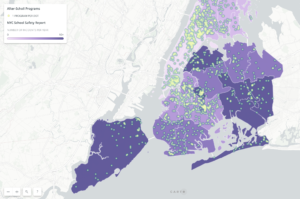
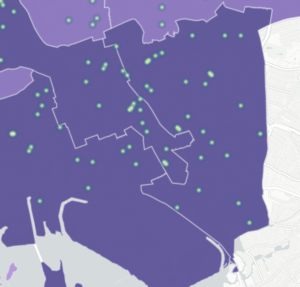
There’s a lot to be talked about Brazilian education and violence. This topic is present when we approach a year of an election. All the candidates say that by increasing the levels of education, we will be fighting crime. For this particular research, most of the data used were brought from (https://opendata.cityofnewyork.us/), I used two separate data, one indicating the crime averages and levels of each district, and another one showing the schools and zones that provide more off-schedule activities for kids. Afer analyzing both data, I had to make sure that my viz was clear and explaining precisely what I needed. To do that I had to make some analysis using Carto, and manipulate the information in my favor.
The results were pretty clear; I managed to achieve an interesting visualization of the problem that I wanted to answer and also made it very informative to the viewer. We can definitely see on the map, that areas that have a less amount of off-school activities are also more present with crime. And areas wich keep their students off the streets have a less crime ratio. For future directions, I think that government parties could amplify this research and make it a useful weapon to address the topic.
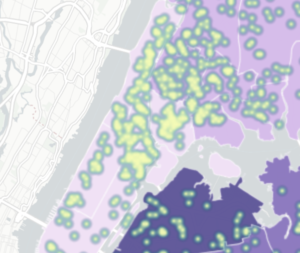
https://acarmo.carto.com/builder/b5692a77-0359-41b4-97ef-5fa87a58dc9f/embed
The post NYC School Safety Report – 2010 – 2017 appeared first on Information Visualization.