This was certainly the most challenging graph of the semester. The visualization is a representation of the Marvel Universe Social Network. The network shows which characters of the Marvel Universe are connected to one another. Because the network only shows if the characters have ever interacted with each other at any level the connections of the network are symmetrical. The network is single mode as each node represents an individual character. This mode makes it easier for the user to quickly understand the network and its components. I originally selected the data because I used to collect Iron Man comics and thought I could sort out or at least know most of the super heroes. It was immediately obvious that I did not have the knowledge required to immediately sort through the connections and some of the more obscure characters. Because of the number of nodes and edges the network visualization was very unwieldy, especially before colors were added.
My first attempt to sort through the visualization was to isolate the characters with the most centrality. I was attempting to create an ego network which focused on the characters with the highest degrees. Unfortunately the main cluster of the network was too dense and I could not isolate the larger nodes on their own. This led me to analyze the visualization as a structure-level network. This mode allowed me to look at how the entire system was connected. I then decided to try and figure out the modularity of the network. After running Gephi’s modularity check of 1 I looked through the nodes trying to identify how similarly colored characters were connected. Figuring out their connection would give me a better idea as to how the clusters were organized and what each color might mean. On my first attempt I noticed that characters from the X-Men were easily identifiable and, with the exception of a few, most of them were clustered around the same region. However there were other characters that belonged to similar Marvel Universe groups that were colored differently. This meant that the modularity of the network was not accurate enough. I then ran a modularity of 1.25 this gave me less clusters but in the process it also clustered characters that I knew were in different Marvel Universe groups together. Running a magnitude of 1.1 seemed to do the best job. Here is the graph that I ended up with.

As you can see there are three major clusters and a multitude of smaller ones. I was able to identify three large clusters, the X-Men (mustard colored cluster on the right side), Spider-man (purple color at the top) and the Avengers (green colored cluster on the left). There were also red colored nodes sprinkled throughout which after some research I figured out were superheroes that belonged to small Marvel Universe factions that were interconnected with larger groups. Satisfied with the network visualization and the clusters that had emerged I decided to attempt to create a hyper-graph with the help of the Professor. My hopes were that I would end up with a network visualization that showed connections between different Marvel Universe groups. We managed to manipulate the data in order to create the hyper-graph. Because the hyper-graph was to be a representation of the connections between clusters, each node in the hyper-graph would represent one of the clusters from the original visualization. When we imported the data to Gephi we wanted the size of the nodes to be representative of the degree of that cluster. As time ran out I was unable to complete the hyper-graph. Here is the visualization unfinished.
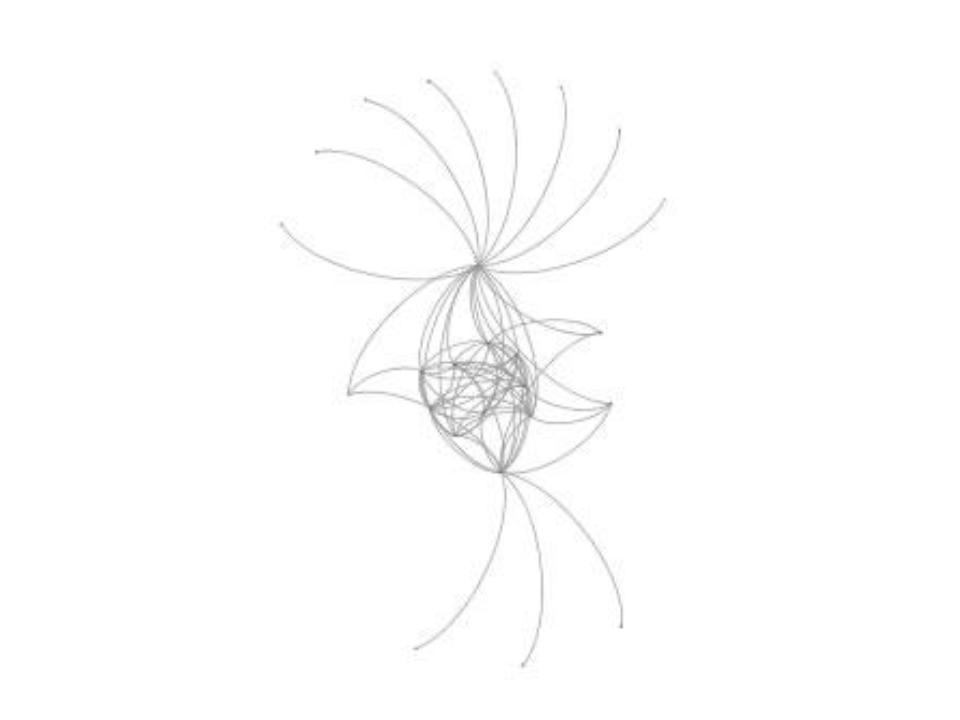
You’ll notice that unlike the original visualization which had a few isolated clusters, the hyper-graph has no isolated nodes.
A pattern that called my attention in the original graph was a handful of characters had a larger degree than the majority of the characters in the Marvel Universe. These were Iron Man, Captain America, Dr. Strange, Wolverine and Spider-man. In fact these characters had such high degrees that they immediately stood out due to their node sizes. I think this made the visualization a good representation of what has been happening at the box office in the past few years; four of the five largest nodes are the most popular superhero franchises today. It made me wonder about the centrality of the characters in the Marvel Universe and how it translates into their popularity in our world.