
Introduction
Data visualization has an extensive history. Tables date as far back as the second century, with the earliest maps appearing in the 12th century, and math- and statistics-related visualizations emerging in the 17th century. More recently, following the invention of the computer in the 19th century and with incredible advancements in computer technology just in the last few decades, I chose to showcase six inventions and improvements in computer technology that helped revolutionize data visualization, boosting it into the modern era.
Tools Used
The timeline was created using Northwestern University Knight Lab’s interactive timeline-creation tool, TimelineJS, an open-source tool available in over 60 languages. A user creates their timeline by first entering information into a Google spreadsheet, and media to be shown on the timeline can be pulled in from a variety of sources, including YouTube, Vimeo, Twitter, Flickr, Google Maps, Dailymotion, Wikipedia, SoundCloud, and more. Also, more advanced users can utilize html, CSS, and JSON to customize their timelines.
Methods and Process
Hundreds of years ago, the first visualizations surfaced with the mapping of stars and other bodies in the sky to help with navigation and exploration. For ages, data visualizations that could be reproduced and transported relied on the medium of paper. It wasn’t until the 19th century with Charles Babbage’s invention of the Analytical Engine, the first computer, that a paradigm shift occurred into a new technological age. Since then, the computer has come a long way, originally starting out with Babbage’s mechanical digital machine and transforming into an electronic digital device in modern times starting in the 1940s with the Colossus in the UK in 1943 and the Electronic Numerical Integrator and Computer (ENIAC) in the US in 1945. In more recent decades, even further advancements in computer technologies have made it possible for the creation of complex and intriguing data visualizations, particularly due to our newly evolved capability to process high volumes of data. I wanted to focus on technologies that I felt deeply transformed what was possible when creating data visualizations.
Results
CLICK TO OPEN TIMELINE
The six technologies that I chose to spotlight on the timeline were cloud computing, SuperPaint (the first graphic design program), the digital spreadsheet, the Python computer programming language, the R computer programming language, and Tableau data visualization software.
I was surprised to find out that while cloud computing seems to be a very recent phenomenon with the term being coined in 1996 by Compaq Computers marketing executive George Favaloro, that the idea for it had been contemplated in a series of memos in 1962 by the computer scientist Joseph Licklider. I wanted to bring attention to this technology because – with the relatively recent capacity for users to access software, computing power, files, services, and more over the Web instead of from their own computers and networks – it has become possible to process vast amounts of data without the burden of continually procuring more and more hardware and software on site. I chose to add the introduction of the first graphic design program, SuperPaint, in 1972 to the timeline because I wanted to know what had preceded such widely used software as Adobe Photoshop and Illustrator, which were introduced in the 1980s.

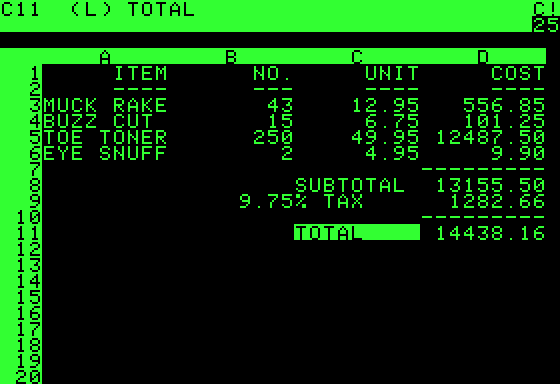
Because many data visualizations nowadays are created from vast quantities of data, I thought about how important the spreadsheet has become. My research brought me to the first digital spreadsheet for personal computers, VisiCalc, which was introduced for the Apple II in 1979 and for the IBM PC in 1981.
I also wanted to bring attention to two computer programming languages that are widely used for data visualizations, Python and R, which were introduced around the same time in 1991 and 1993, respectively. My final addition to the timeline is the data visualization software Tableau, which I thought was an interesting juxtaposition next to my two preceding timeline entries of Python and R, as one can utilize Tableau without having to know any computer programming. And in that sense, I felt it was a fitting technological advancement to round out my timeline as evidence of the continual developments in computer technologies.
Reflection
When researching history, I’m always reminded as I peruse a variety of material that history is not always unanimously agreed upon. For example, there seems to be disagreement on the first electronic digital computer, and some authors appeared to deal with this by listing off several machines from the ’40s while some claimed it’s just one of them. While this was not an event I added to the timeline itself, I did want to use the information in setting up my background explanation for why I chose the six technological advancements that I decided on. I found the best way to remedy this was simply to keep reading from a variety of reputable sources, observe any discrepancies in the information as well as technical details about the devices that make them relevant or not for the context of my research, and then come to a conclusion.
I also felt that because technological advancements exist on a continuum, while sometimes there are obvious revolutionary moments (perhaps only because it’s in hindsight), sometimes that is not so. And in that regard, I had to make decisions about which events I would add to my timeline. For example, I chose to pass over Richard Mattessich’s ideas for the digital spreadsheet in the ’60s as well as Rene Pardo and Remy Landau’s advancements in electronic spreadsheet technology in the ’70s via the LANPAR (LANguage for Programming Arrays at Random) compiler because both were used for mainframe computers and not for personal computers.
In terms of utilizing TimelineJS, I liked how easy it was to tweak the aesthetics even in the simplest of ways, for example, by changing the background color using a hex color code.
Sources
Computer History Museum. SuperPaint is Completed. Timeline of Computer History: Graphics and Games. https://www.computerhistory.org/timeline/1972/#169ebbe2ad45559efbc6eb35720566af
Editors of Encyclopaedia Britannica. (2021, December 22). Charles Babbage: British Inventor and Mathematician. https://www.britannica.com/biography/Charles-Babbage
Friendly, M. (2006). A Brief History of Data Visualization. Handbook of Computational Statistics: Data Visualization. https://www.datavis.ca/papers/hbook.pdf
Galassi, G & Mattessich, R. (2015). Some Clarification to the Evolution of the Electronic Spreadsheet. Journal of Emerging Technologies in Accounting. doi.org/10.2308/jeta-51114
Geeks for Geeks (2021, July 22). Data Visualization with Python. https://www.geeksforgeeks.org/data-visualization-with-python/
Internet Society. Internet Hall of Fame Pioneer: JCR Licklider. Internet Hall of Fame. https://www.internethalloffame.org/inductees/jcr-licklider
Jariwala, D. (2016, December 29). 7 Visualizations You Should Learn in R. https://www.r-bloggers.com/2016/12/7-visualizations-you-should-learn-in-r/
Levy, S. (2014, October 24). A Spreadsheet Way of Knowledge. Wired. https://www.wired.com/2014/10/a-spreadsheet-way-of-knowledge/
Pandey, P. (2018, September 24). Data Visualisation with Tableau. Tutorials. https://www.datacamp.com/community/tutorials/data-visualisation-tableau
Regalado, A. (2011, October 31). Who Coined “Cloud Computing”? Technology Review. https://www.technologyreview.com/2011/10/31/257406/who-coined-cloud-computing/
Swaine, M.R. & Freiberger, P.A. (2015, November 5). Atanasoff-Berry Computer. Encyclopedia Britannica. https://www.britannica.com/technology/Atanasoff-Berry-Computer