
The New York Legislature made headlines at the end of 2020 when it passed a law placing a moratorium on residential evictions in the state. This law extended the nationwide protections initially offered to tenants by the temporary ban on evictions imposed by the Centers for Disease Control in September of that year. As of this writing, the New York State moratorium has been extended to August 2021 for tenants citing COVID-related financial hardship. This was a relief for millions of New Yorkers squeezed by the economic impact of the pandemic, finding themselves out of work and struggling to cover expenses. Although this bill was very popular, and the relief it offered was well-received, tenant advocates argue that this is an insufficient solution to the persistent, worsening problem of housing security in New York City.
In addition to having one of the highest costs of living of any city in the United States, New York City also has one of the highest rates of poverty among large U.S. cities. This story of inequity is familiar to Americans all over the country, but anecdotally, New Yorkers seem to endure a remarkable amount of stress around their housing conditions. Using newly acquired geographic information systems (GIS) skills, I wanted to explore this topic spatially. What was the housing landscape like in 2019, the last “normal” year before the pandemic hit the city? What can open data tell us about the condition of the housing stock in New York City, the rate of evictions, and who was most impacted?
City Agency Data Inspires Research
My work in this project was informed and inspired by research conducted by the New York City Council Data Team and the Office of the Public Advocate. The Data Team’s Evictions page on the City Council website offers data visualizations about evictions in the city, accompanied by tenant protection resources. The Office of the Public Advocate publishes a Worst Landlord Watchlist, now in its second annual release, that names the 100 individuals responsible for the most neglected private buildings in New York City. Their methodology involves aggregating the number of moderate and severe violations issued to residential buildings by the Department of Housing Preservation and Development (HPD).


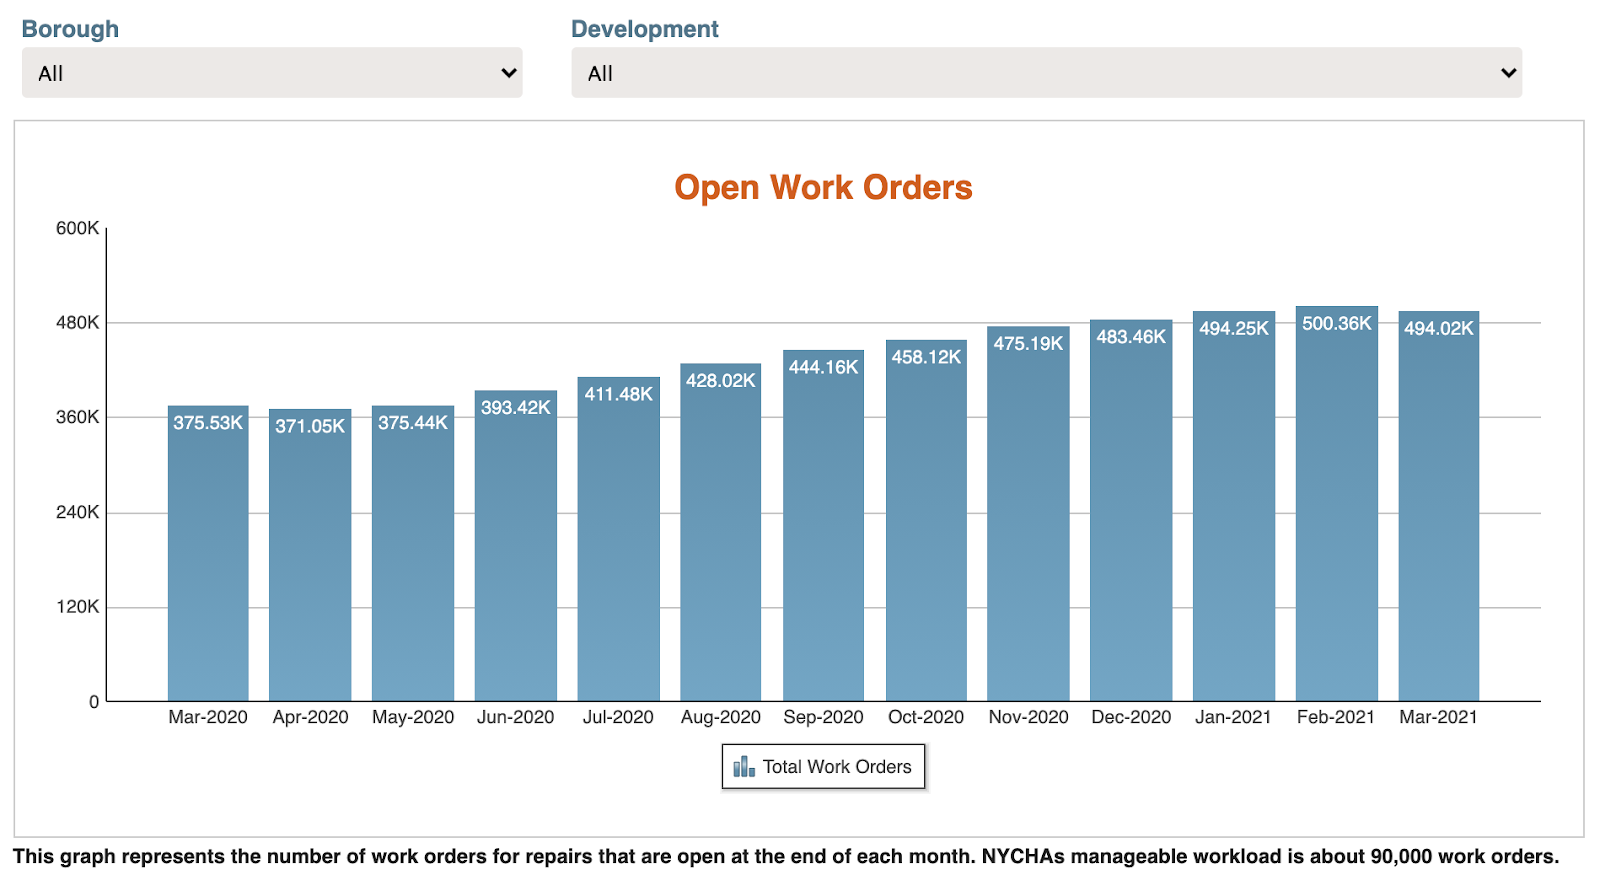
Topping the list of worst landlords in 2019 and 2020 was the New York City Housing Authority (NYCHA), which provides public housing to over 500,000 low-income New Yorkers. Public Advocate Jumaane D. Williams described NYCHA as being “in a league all its own” when describing the scope of the agency’s negligence in comparison to the private landlords on the list.
I was inspired to recreate some of the findings of City Council and the Public Advocate using open data from city agencies. NYCHA buildings are not served housing violations by HPD, but instead operate on an internal work order system. In 2020, there was an average of 341,325 open work orders across 326 housing developments—these are the calculations that landed NYCHA its spot at the top of the Worst Landlord Watchlist.
Unfortunately, details about NYCHA work orders are not publicly available data, so I looked to NYC Open Data for information on private residences citywide.
Context: The Climate for Renters
Before diving into the housing data, I’d like to establish a baseline for understanding the economic and demographic climate in New York City using data from the United States Census Bureau. The American Community Survey (ACS) provides detailed demographic information tied to every census tract and releases estimates annually.
The static maps below were created using QGIS, a free and open-source GIS program that is excellent for conducting geospatial research and visualization. The basemap was designed using Mapbox.
Most New Yorkers Rent

In this map, I’ve highlighted census tracts where at least 75% of the households within are rented, as opposed to owned, by residents.
Many Live Below the Poverty Line

In these areas, at least 1 in 3 New Yorkers live below the poverty line. I want to be mindful of not erasing the presence of people living below the poverty line in every single census tract in the city. However, by limiting my legend to these values I could show the areas where poverty is most concentrated.
Most are Rent Burdened

When these two factors combine, they make for an extremely rent burdened city. These are areas where the median amount of income spent on rent was at least 30%—this is the threshold for rent burden. Please note that this dataset is limited in that survey options limited in that the percentages only ranged from 0% to 50+%.
Non-White New Yorkers

In this map, I’ve highlighted the areas where at least 57% of residents are people of color.
Non-Citizen New Yorkers

And finally, in these areas, a share of at least 25% of residents are not U.S. Citizens.
It is important for me to establish this baseline of understanding because poor and middle-class black, brown, and immigrant communities are integral to my case. They are more likely to have to endure substandard housing conditions, exploitation, and intimidation by their landlords, all while carrying an immense rent burden—a set of circumstances I will refer to as renter hardship.
Concentrated Renter Hardship
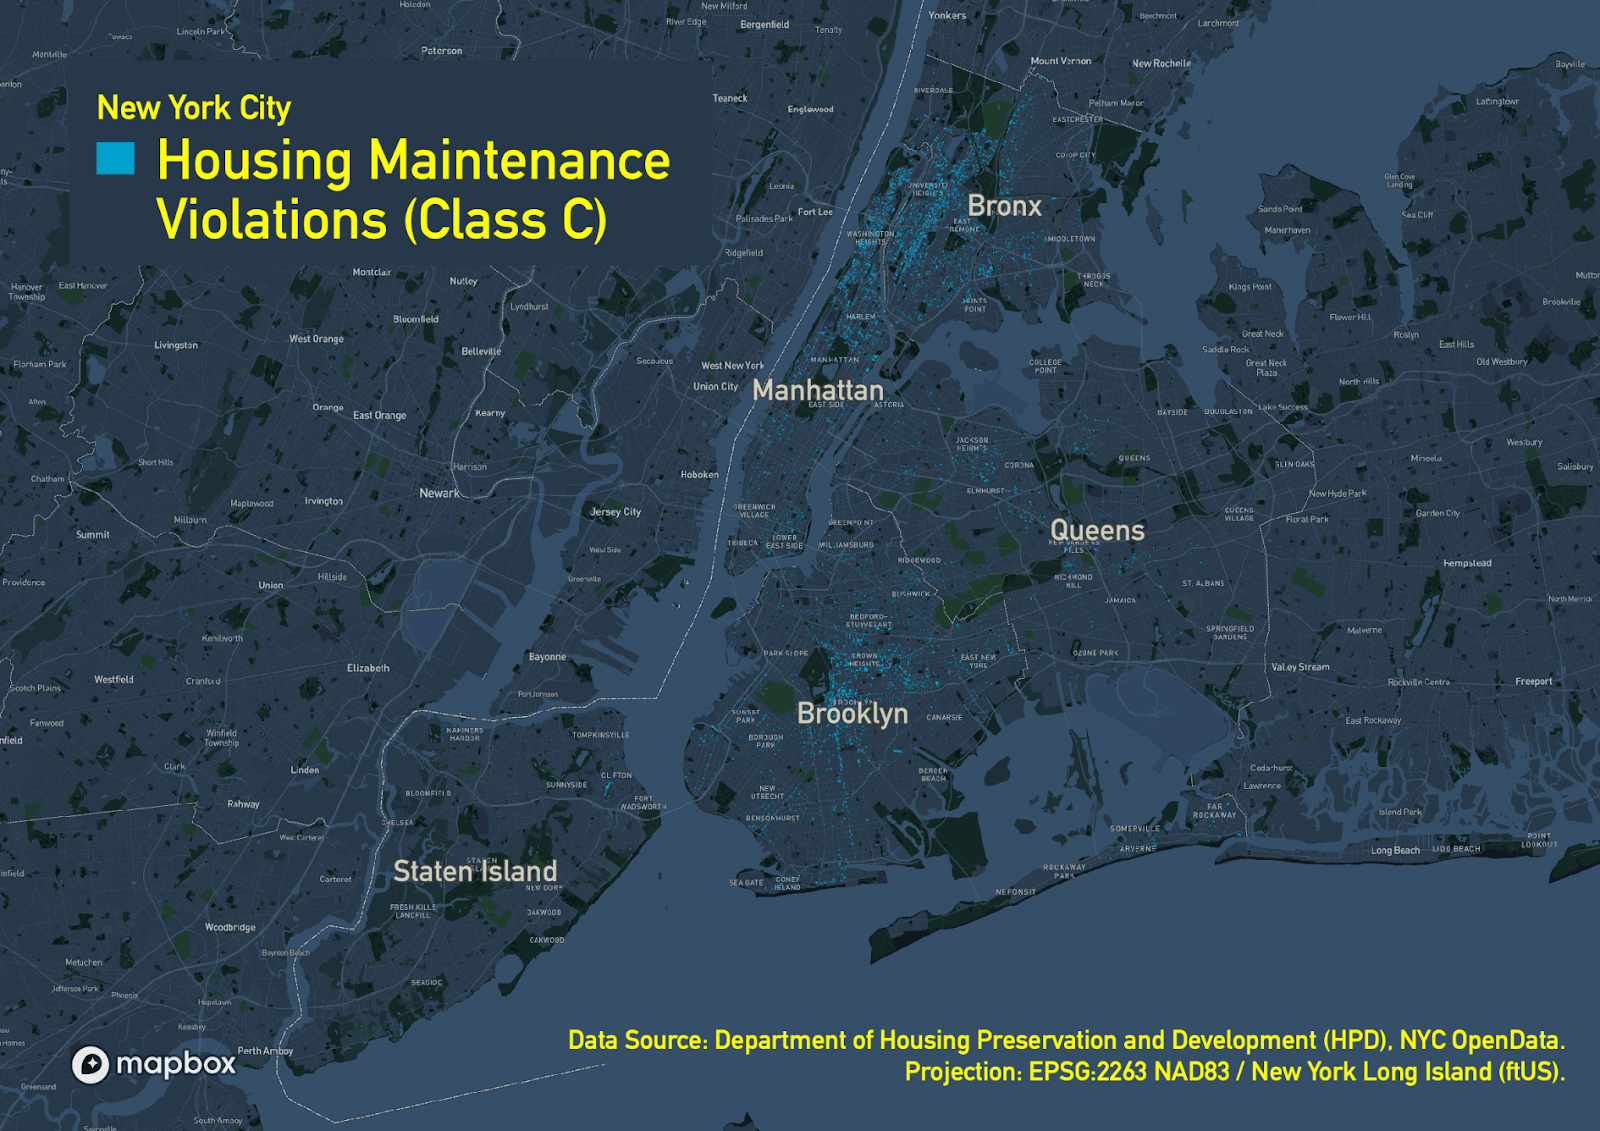
Neighborhoods in the South Bronx, Upper Manhattan, and Central Brooklyn emerge as likely sites for high renter hardship according to ACS data. To validate this observation, I began collecting data on citywide evictions executed by the City Marshall and housing maintenance code violations, which are issued by HPD. The housing maintenance code violations file for 2019 was huge (over 615,000 rows), so I had to drill down aggressively to get a manageable, but still meaningful, body of data. I selected only class C violations—the most severe—issued that year. My dataset was still quite heavy, so I parsed it down to just the violations that were still open at the time the report was generated in April of 2021.
After attempting to plot the data in QGIS using coordinates and tax lots, I decided to join these tables to a building footprints file on the BIN (Building Identification Number) field for greatest accuracy. The product of that process is pictured below. Each dot represents one of 16,000 buildings with a total of nearly 50,000 class C violations from 2019 that were still open at the time of this writing. Observe the clusters of blue buildings in the South Bronx, Upper Manhattan, and Central Brooklyn. Landlords in these areas are falling short of their responsibility to maintain habitable dwellings for their tenants.
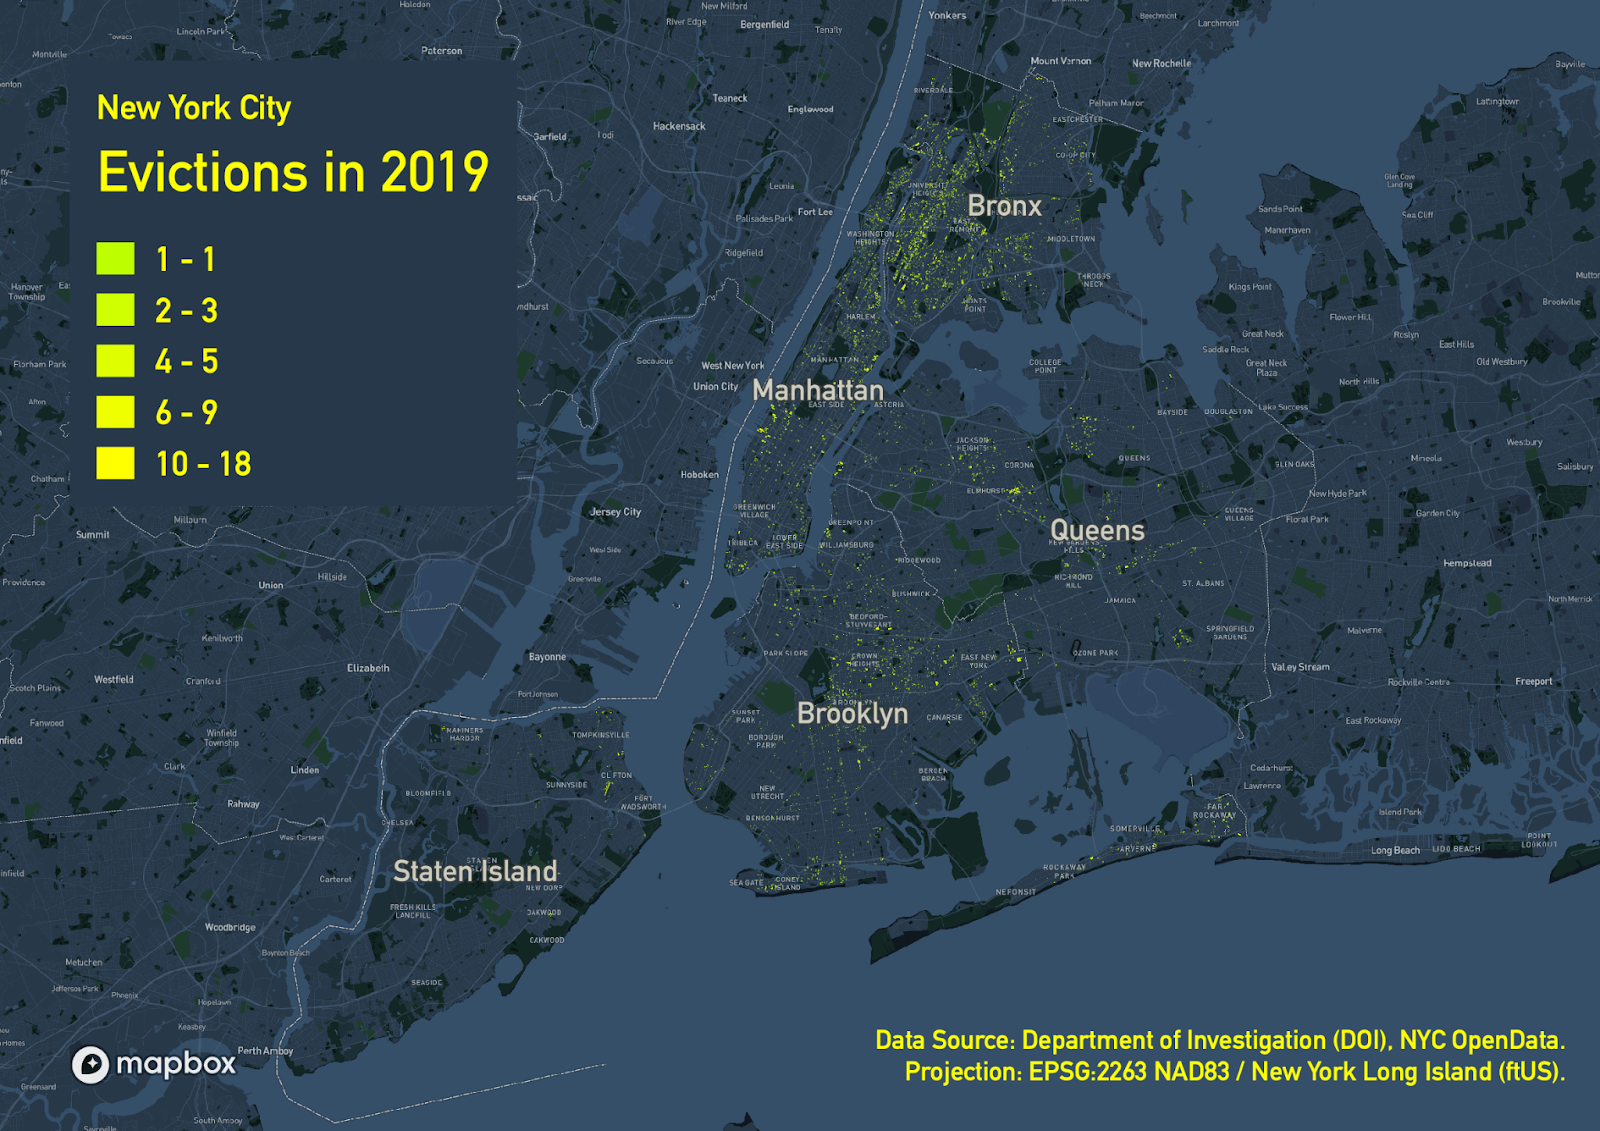
As with the violation data, I began processing my eviction data by joining it to building footprints on the BIN field. The result of this one-to-many join produced overlapping building shapes where there had been multiple evictions in a particular building. I leveraged this by performing a reflexive join that counted multiple evictions and appended these values in a new column. This enabled me to style my eviction data based on the number of instances at each site. The result of this process is below. Each dot represents one of the roughly 11,000 buildings across the city that saw over 16,000 evictions executed in 2019.
From Static to Interactive Mapping
Once again, we find that there is a greater density of dots in the South Bronx, Upper Manhattan, and Central/East Brooklyn. At this point, these static maps were shared with other School of Information students to test for usability. After a brief explanation of the topic, users were instructed to share their impressions of the maps’ design and demonstrate their understanding. A common complaint from these users involved the legibility of the violation and eviction data. In the small-scale view, most building footprints are so small that they are usually indistinguishable from each other, and sometimes practically invisible. While users found the visual compelling, they expressed disappointment at not being able to explore this dataset further themselves.
To address this major limitation, I created an interactive map using Carto. Carto is a cloud-based mapping software that can handle many kinds of tabular and spatial data, so I could begin working with the shapefiles that I created in QGIS right away. In recreating my QGIS creations, I found that using all 5 layers of ACS data made for a cluttered and hard-to-read map. In the interest of a clean and focused visualization, I chose to discard all layers except rent burden. The problem of rent burden in New York City is most salient to the issues of tenant hardship that I am exploring in this project. I added tooltips that display data on rent burden, non-white populations, and residents living below the poverty line to further enrich this layer.

Tooltips are enabled for the violation and eviction layers as well. They appear on hover, which signals to users early on that there is more embedded information available in this map than first meets the eye. My design encourages users to zoom in for clarity, explore the data, and formulate conclusions.

By engaging with this interactive map, we can observe that these clusters of open violations and evictions are more than proximate—in many instances, they directly overlap. Following are select examples from the Concourse section of the Bronx, Harlem in Upper Manhattan, and the neighborhood of Brownsville in Brooklyn. What these neighborhoods have in common are that the residents are most likely rent burdened, more likely to live below the poverty line, and more likely to be people of color.


The Outlook for Renters
My findings confirm that beyond the Worst Landlord Watchlist, building owners all over New York City are subjecting their tenants to substandard housing conditions. The concentration of persistent housing violations in low-income areas suggests that these renters may not have other options within their financial reach. It also suggests that landlords, taking advantage of the city’s low vacancy rate, are not motivated to disburse the funds needed to keep their buildings clean, safe, and livable. The trend of landlords neglecting buildings and their tenants in poor and middle-class communities of color is par for the course with regards to larger systemic issues of racial segregation.
Tenants, especially those living in rent-regulated buildings, have rights and protections under New York City Law, but may not know them or may not feel empowered to speak up for fear of retaliation. Other tenants may not have the time or resources to pursue a case in Housing Court against their negligent landlords. On the flip side, New York City landlords do indeed have the time to fight their tenants in Housing Court. The eviction data used in this study only included the small proportion of eviction petitions filed by building owners that were actually executed by the City Marshall (roughly 10%).
Furthermore, until recently, tenants who took their landlords to Housing Court could end up on one of many unofficial “Tenant Blacklists.” These lists are compiled using public data, make no distinction as to the legitimacy of the tenant’s claims, and could be used by landlords to deny apartment applications. This makes it more difficult for a tenant plaintiff to find new housing if and when they move. The Housing Stability and Tenant Protection Act of 2019 bans the use of such blacklists and provides protections against retaliatory evictions—for example, being evicted from one’s home for filing a case in Housing Court or participating in a rent strike.
This isn’t the only recently passed legislation that seeks to disrupt the system that landlords and building owners leverage to exploit tenants. The Certification of No Harassment (CONH) pilot program created by City Council law in 2018 requires landlords of buildings where there have been previous findings of harassment to file for and receive a CONH before conducting certain construction work.
In the same year, the Department of Housing Preservation and Development developed the Speculation Watch List to flag rent-regulated buildings that recently sold for a high price. According to the law’s statement of basis and purpose, “When a purchaser is willing to pay more than the property value, it indicates a greater potential for tenant harassment so that the purchaser can recoup its inflated purchase price through forcing tenants out in order to escalate rents.”
For the final phase of this study, I geocoded the Speculation Watch List data available on NYC Open Data and laid it over the HPD violation and eviction layers. I noticed clusters of recently-sold buildings in low-income but gentrifying neighborhoods such as Flatbush, Sunset Park, and Washington Heights. Many of these buildings have persistent violations from 2019 and were sites of evictions that year as well.


Now that the Speculation Watch List has been established and is updated every quarter, it is not quite clear what the next steps to protect tenants in these buildings will be. Nevertheless, the reception of the Worst Landlord Watchlist shows that if all else fails, public shame can be an effective strategy against negligent landlords.
Renter Hardship: Interactive Map (Carto)
Selected Resources
American Community Survey 2019 Tables, United States Census Bureau
Tenure By Occupants Per Room
Race
Poverty Status in the Last 12 Months
ACS Demographic and Housing Estimates
Median Gross Rent as a Percentage of Household Income in the Past 12 Months (Dollars)
Nativity and Citizenship Status in the United Status
NYC OpenData Tables
Building Footprints | Department of Information Technology & Telecommunications (DoITT)
Evictions | Department of Investigations (DOI)
Housing Maintenance Code Violations | Department of Housing Preservation and Development (HPD)
Speculation Watch List | Department of Housing Preservation and Development (HPD)
Resources for Tenants
Tenant Protection Laws | Mayor’s Office to Protect Tenants
New York City Tenant Resource Portal | Mayor’s Office to Protect Tenants
Changes in New York State Rent Law: What You Need to Know | New York State Attorney General
Forming A Tenants’ Association | Met Council on Housing
Rent Strike Toolkit | Housing Justice for All