Intro
For our fourth lab, we learned the ins and outs of QGIS, an open-source geographic information system. As a New Jersey resident, I thought it would be interesting to see what interesting information I could find that had possible correlations. For this project, I took a look into the locations of childcare centers and environmental concern sites around New Jersey. New Jersey is the most densely populated state in the country, leaving it very vulnerable to environmental concerns. With that said, many families decide to settle in New Jersey due to its proximity to the city and good schooling systems. Recently, there have been many debates about the ethics of having children in the midst of the climate crisis. This map takes a look into the safest places for child care centers and possible correlations between the two.
Methodology and Materials
The Program
We were asked to use QGIS to create a geographic data visualization. QGIS is a very interesting program and has a lot to offer in terms of map creation and personalization. Out of all the software we have been asked to use for data visualization in this class, QGIS is definitely the most confusing since it has its own set of functions and tools that aren’t very explicit in what they do. Despite this, it was very interesting to use to create visualizations!
The Data
The datasets used for this project were taken from New Jersey’s Bureau of GIS Open Data. The website had copious amounts of information to look at, as well as an easily digestible summary of the dataset you were looking at. After browsing the datasets, I took the two that I thought could be measured against each other and downloaded them as shape files. The website had many download format options, including CSV and GeoJSON files. I initially tried downloading the two files as CSV files, but after hours of troubleshooting with no results I went back and downloaded them as shape files which was much easier to deal with in QGIS. Downloading the shape files proved itself to be the easiest since they featured a vector file that could easily be manipulated in QGIS considering my limited skillset with the program. Additionally, the website featured a base map with New Jersey’s counties which I found to be extremely helpful.
Creating the Map
To create the map, I first uploaded the vector file of the New Jersey counties along with the two CSV files of the child care centers and environmental concern sites in NJ. After about two hours and six different YouTube tutorials about getting the CSV files to show up as data points on the map, I gave in and downloaded the vector files which showed up on the map almost immediately after I imported them into QGIS. The environmental concern sites were initially data points as well as the child care centers, so I decided to turn the concern sites into a heat map to better show the general problem areas in New Jersey and allow for the child care centers to be seen more clearly. After all the data was on the map, I made labels for each county using the label function and a column of the dataset that featured the shorthand codes for each county in New Jersey.
Results
Here is an image of the final map:
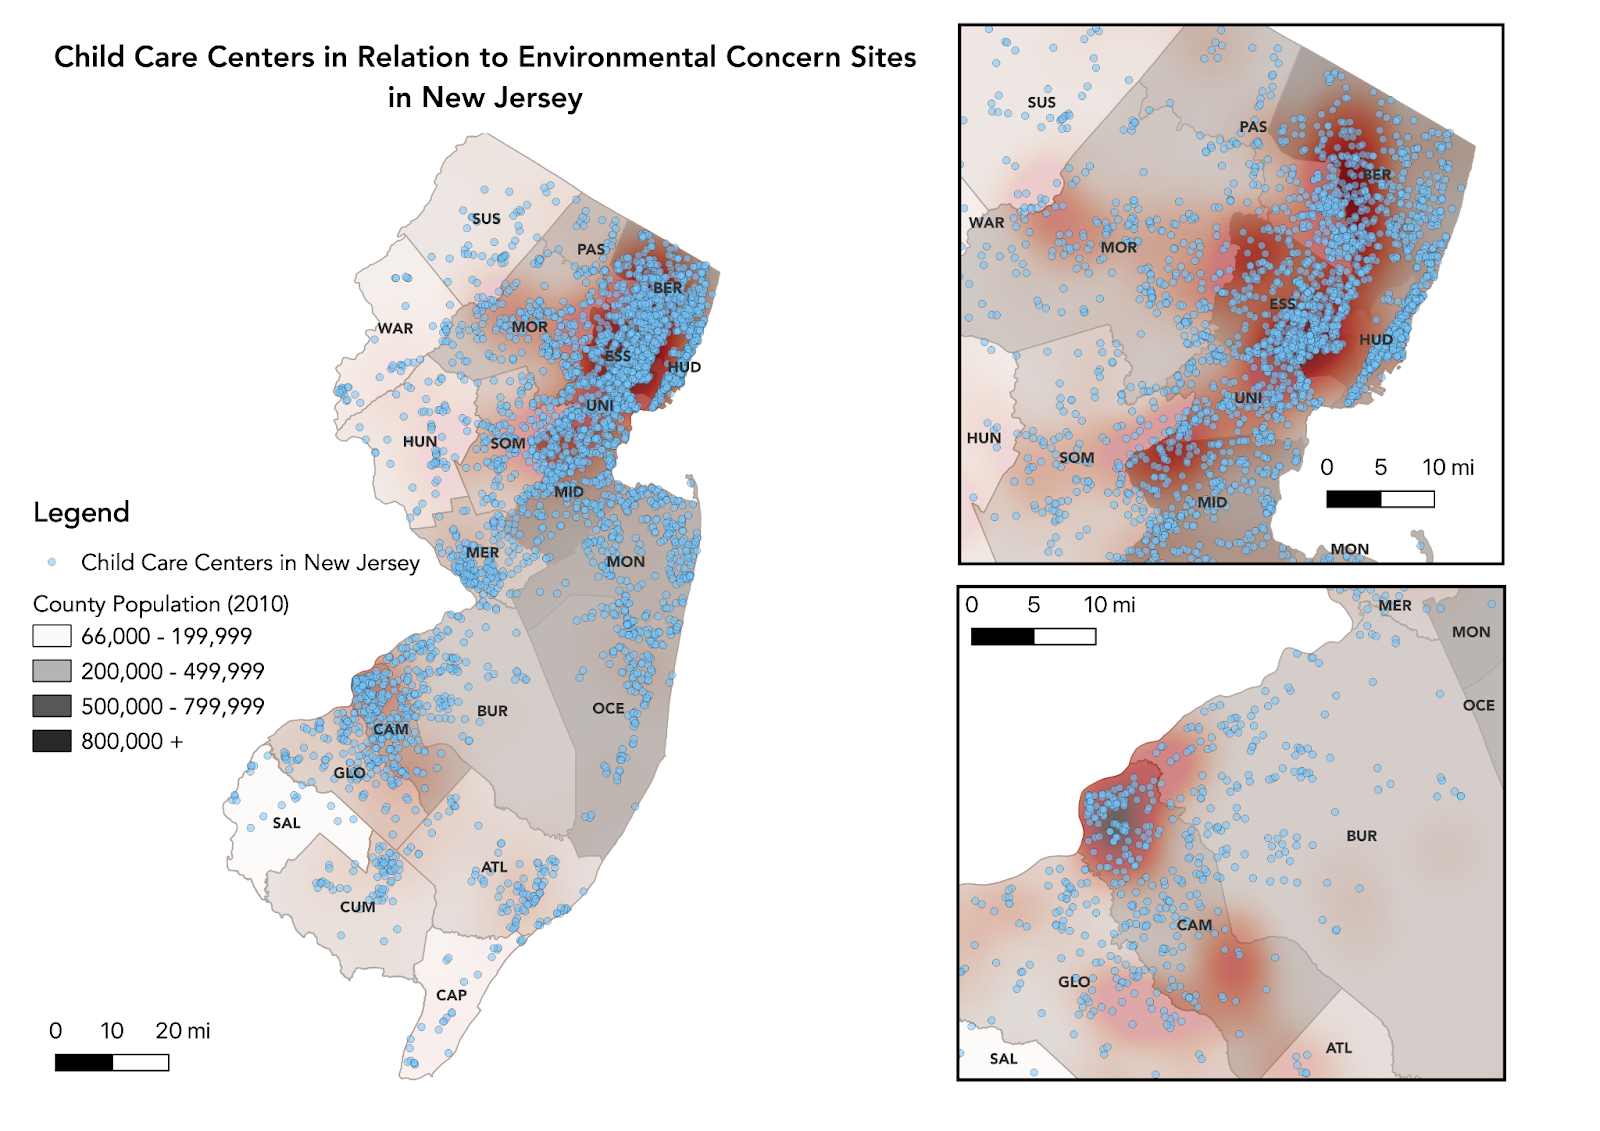
The final map features a heatmap of environmental concern sites in NJ, blue points that represent child care centers, and the population density of each county shown through a gray themed scale. Two areas of the map are highlighted, since they are more densely populated with childcare centers and zooming in makes it easier to see the heatmap and population density.
From the map, we can see that population density and environmental concerns are heavily correlated, since the two most densely populated areas on the map have the most red. One thing I found interesting was the number of child care centers in Monmouth county, despite not having many environmental concern sites in its area. This gives me reason to believe that Monmouth county is a safe place to raise your children if you want to steer clear of any environmental concerns while still living in a relatively populated area.
The counties in the top right corner of the map appear to be the most densely populated in New Jersey, which can explain the large amount of child care centers shown. As someone who has lived in both Hudson and Essex county, it’s not surprising that these areas are the most densely populated due to their ease of access to New York City and good education systems. That being said, many areas in these counties are very industrialized, which could explain the high density of environmental concerns.
This map can be used as a good resource for families with children looking to settle down but want to be aware of environmental concerns surrounding them and possibly avoid them if possible.
Reflection
Overall, I am very happy with how the map came out, and the problems I experienced with the program helped me to understand it more. Initially I was just going to have the concern site heat map and the childcare centers, but realized in my analysis that the population density was necessary to show as well since it allowed for deeper insight into the visualization. While creating the print layout of the map, QGIS shut down on me three times without saving my progress which led to some frustration but I persisted! There were a lot of different functions that I had to look up how to do in order to get to my final map, but doing so allowed me to get a deeper understanding of the software and its capabilities.
Sources
“County Boundaries of NJ.” 2022. NJDEP Open Data. https://gisdata-njdep.opendata.arcgis.com/datasets/newjersey::county-boundaries-of-nj/explore?location=40.134835%2C-74.743150%2C8.89.
NJDEP Bureau of GIS. 2018. “Child Care Centers of New Jersey.” NJDEP Open Data. https://gisdata-njdep.opendata.arcgis.com/datasets/njdep::child-care-centers-of-new-jersey/explore?location=40.103228%2C-74.739900%2C8.92.
NJDEP Bureau of GIS. n.d. “NJDEP Open Data.” NJDEP Open Data. Accessed November 17, 2022. https://gisdata-njdep.opendata.arcgis.com/.
NJ Dept. of Environmental Protection Bureau of GIS. 2021. “Immediate Environmental Concern Sites in New Jersey.” NJDEP Open Data. https://gisdata-njdep.opendata.arcgis.com/datasets/njdep::immediate-environmental-concern-sites-in-new-jersey/explore?location=40.164023%2C-74.726250%2C8.96.