INTRODUCTION
Game of Thrones is a series based on George R.R. Martin’s best-selling book series “A Song of Ice and Fire”. This captivating series gained immense popularity because of the vast plethora of characters and its intriguing plots. Being an admirer of the series, I decided to create a network visualization and analysis based on its characters.
INSPIRATION
During my research, I came across 2 network analysis projects that were detail-oriented and well organized.
The first ‘ Network of Thrones – The song of Math and Westeros’ showcased clusters of 6 communities and it’s prominent characters. The nodes and edges were easy to spot because of the colors used.
Game Of Thrones – A Social Network Analysis was another post that caught my attention. The author tries multiple permutations and combinations to achieve a visualization that makes identifying the characters and their connections easy.

TOOLS
Open Refine was used to view and refine the downloaded data. The data was then saved in a CSV format and put into Gephi to start creating the network visualization.
PROCESS
- Finding the dataset and importing it to Gephi
Andrew Beveridge’s GitHub – A Song of Ice and Fire Page
The dataset used for this project was downloaded from Github. The dataset was clean and did not need a lot of refining.
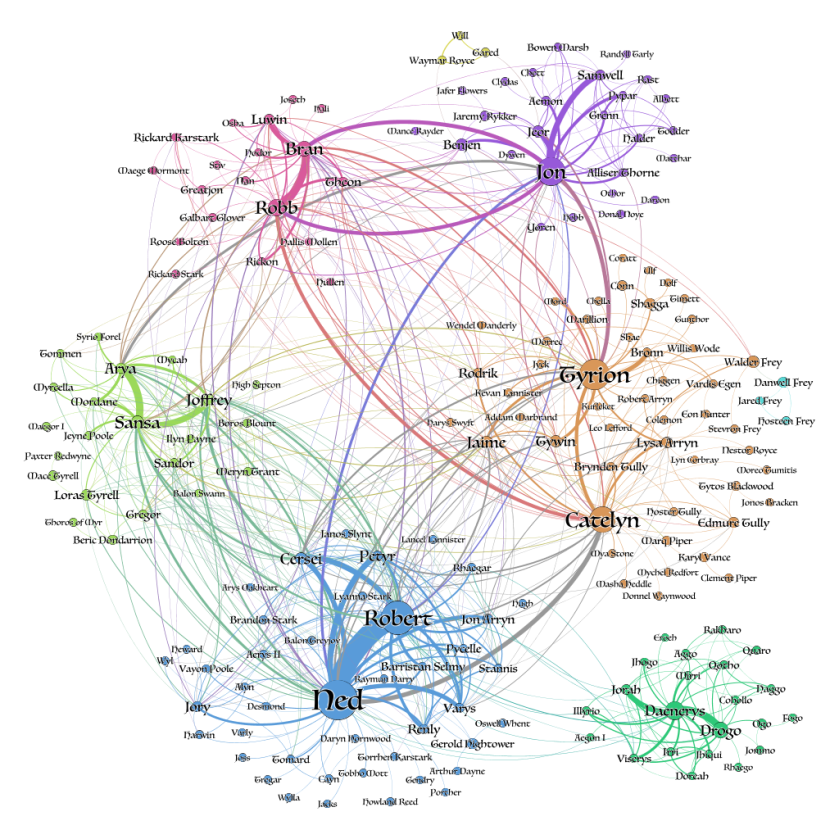
The networks were created by connecting two characters whenever their names appeared within 15 words of one another in the books. The edge weight corresponds to the number of interactions.
The dataset was then imported into Gephi as 2 tables – nodes and edges.
- Nodes – 796
- Edges – 2823

- Experimenting with the visualization
At first, it was difficult to make sense of the visualization. It was too complicated because of the large number of characters and all their multiple connections. I started experimenting with the different layouts available in Gephi in order to make it easier to understand. Fruchterman Reingold was used for the final visualization (Area: 10000.0, Gravity: 10.0, Speed: 1.0).
- Improving the visualization
After finalizing the layout, I started changing the color palette to improve the readability and legibility. I didn’t want to use more than 3 colors as it was adding to the messiness. I further worked on the font, font color, and sizes.
- Running statistics
Finally, I ran some statistics for the network visualization –
- Average degree: 7.093
- Average weighted degree: 81.982
- Network diameter: 9
- Graph density: 0.009
- Modularity: 0.563
RESULTS AND ANALYSIS

Based on the visualization, Tyrion Lannister has the maximum number of connections followed by Jon Snow. A few other prominent characters are Cersei Lannister, Jamie, and Stanis Baratheon.
The visualization also suggests that characters that played an important role may or may not have had a lot of connections. The prominent characters and their connections also vary drastically from season to season.
REFLECTION
Gephi is a great software to create quick network visualizations with less effort and at no cost. It makes analyzing networks fun and easy.
If I could add to this project, I would want to specify each character’s house to see which houses were closely connected. I would also want to know which characters were prominent in a particular season.