Xiaxin Chen
Dr.Sula
LIS-658-01 TimelineJS Lab
Introduction
Lab one, work with TimelineJS, mainly to build an interactive timeline through this interesting tool. Based on its tutorial online, I feel this is a very nice and easy-going tool to quickly make the timeline visualization. And because of it can export the html file, that also means this will easy to embed to the webpage and react.js based app which makes me feel this tool will be very useful in the future. Finally, my topic focus on the development of the visualization after 1975. Trying to review some beautiful visualizations to see how visualization work and help people in different fields. The reason why I choose the duration from 1975 to present is because the category of time on the milestones website(www.datavis.ca/milestones). It named the duration from 1975 to present High-D data visualization and point out this should be the accelerate pace during this time, which I feel there might could show some develop pattern of visualization during the recently time.

(part of the final timeline visualization)
Materials and Methods
My visualization is the timeline build by the TimelineJS and with 10 examples to discuss my topic. Those 10 examples come from two websites, the milestones(www.datavis.ca/milestones) we used on the lab, and the infovis(http://www.infovis.info), a website record some information visualizations. I feel there is not too much content to talk about the method how I build the timeline, generally I follow the tutorial edit the google doc excel then the TimelineJS help me build the visualization there. One thing I think I need to explain is that generally I choose to use image as the background for every example there is because for two reasons. 1st, the TimelineJS do very well job on the distribution the foreground and the background, when you use the image as the background, the shadow created there also help emphasize the text and the main images on the foreground. 2nd, because I’m talking about the developing of the visualization, I think it is better to give an impression of the visualization I’m talking about is better than just choose a noun meaning color there.
Then, start with the first example, the New York Subway Map posted on 1972-1979, since this map ended its mission in 1979, and this map already show a lot principles of modern information visualization design, so I include this example in my visualization. From this example, we could know that before 1975, the time the most recent development time for the visualization field, people already know to use the design skills we still use nowadays, like color code, different subway lines represented by different color; cartoon style, ignore to draw the detail of reality but only use color and lines to show the important message. And I love the idea that the author use square to separate the map into several parts. This will help people understand the change of the distance between each station, this should be very helpful for people estimate their traveling time in that time without the help from smartphone. Than the time come to 1975, the Graphics versus tables, from milestones’ record, it shows Ehrenberg mentioned this, seems he help organize and spared the theory and the idea of use tables and chart to help express the information. And for sure, this influence our daily life a lot, tables and chart already become the very basic visualization strategy nowadays, so did not choose a special example for this part, but try to show that in 1975 the strategy seems become a formal theory.

(New York Subway Map 1972-1979)
Then we can see that in 1980, on one paper, some editor uses the visualization technology to show the change of the New York weather. It is also a good example to show that the table and chart to make the basic but powerful information design to help people’s daily life. The next, time jump to 1999, visualization field got the grammar book here. The author uses a flow map as the representative example for his grammar book, which also on my timeline there. But beyond the image of visualization, the more important things are that I think this is a symbol the visualization becomes a more and more serious science subject, that’s how I understand the word of grammar. What’s more, the things happening after this also prove that the develop of the visualization field accelerate there. In the same year, an important show that people combine the 3d technology to help build the visualization. One thing interesting here is that this 3d contour map has the same description with the Grammar of the Graphics, which I still not sure the reason why this happen. After this, people seems more focus on combine the big data with the visualization. 2002, the cloud text, which is very popular nowadays, big data companies will use this visualization technology when they want to do the comment analysis and want to present their result, like to build the sentiment analysis visualization and so on.

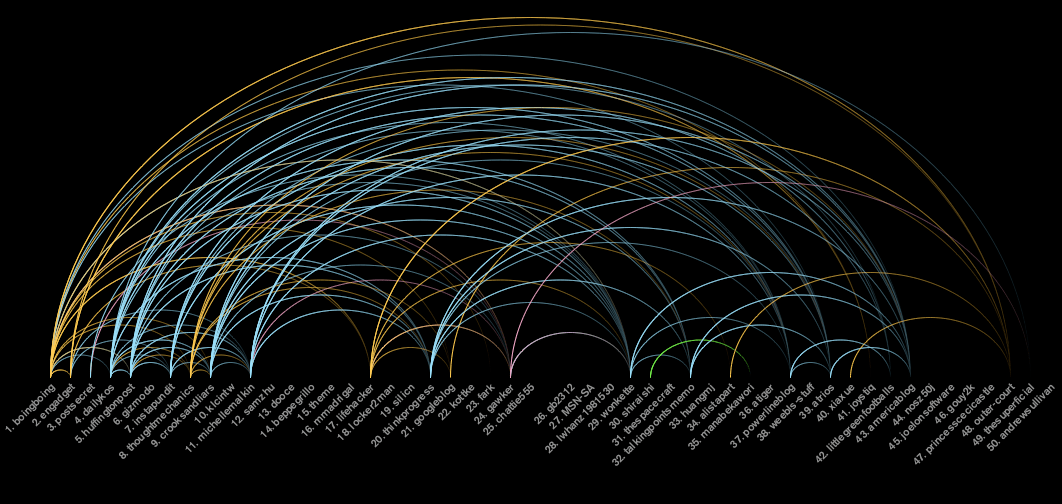
(ENRON’s e-mail pattern)
In addition, some more examples, like Sparklines, simple but useful strategy, very common to see the similar visualization in the stock field. International dot links, like the example ENRON’s e-mail pattern, use dot and link to show the relationship between each element on this map and to find the pattern through the visualization. Linkology, similar way to the dot links, but with a totally different visualization strategy, use curves help build better aesthetics experience. And the last one, the Map of Scientific Paradigms, this time, the scientists give the size of the dot another meaning, make it have more information dimensions on this map. There, based on the examples I found, it shows that from the 21th century to present the study of visualization more and more combined with big data and more and more with the serious science field, which I feel, it means that the visualization technology has become an indivisible part for the data and information science field. The visualization technology will help compress the huge information in a readable way.
(A pair of data-based illustrations commissioned for the February 20, 2006 issue of New York Magazine.)
Result
As the result, I have learned to use the TimelineJS tool build the timeline. I believe there should be more function I did not master yet, but before that I think I should take more care about the result of the content to my topic. Honestly, 10 examples are quiet insufficient for this topic, I picked the examples randomly so I feel they may not so objective to show the idea I got from those examples, that at the beginning of the 21st century, the information and visualization field looks much active than the period of 1975 – 1999. And from the content of those examples, we could see that the examples from 21st century is more about study and science while the example before this period is more about citizens normal life. I guess this is not only because of the fashion of nowadays big data, but also because the visualization has already fusion a lot into the daily life and to draw a subway map, weather summary graph will not be a big news again, so that they did not record on the milestone or other information history recording website. But, in fact, they are still there have more influence. So, in the future, if have any chance to continue this topic, I would like to collect more data to try to visualize the transition that how the data analytics and information visualization join into ordinary peoples’ normal life. And I believe there will be a very interesting story here.


(Some images of my visualization timeline work)
link of the google doc excel for TimelineJS:
https://docs.google.com/spreadsheets/d/1oijyibxbCUhQLBxy5fMOryWEiEm8erJVfBuYzxu9l30/edit?ts=59b1eed9#gid=0
I figure out how to open the timeline, this link should be work:
https://cdn.knightlab.com/libs/timeline3/latest/embed/index.html?source=1oijyibxbCUhQLBxy5fMOryWEiEm8erJVfBuYzxu9l30&font=Default&lang=en&initial_zoom=2&height=650