
Introduction
Les Misérables is a French historical novel by Victor Hugo. It depicted the miserable life of French people in the early 19th century. Building upon a dataset recording all the connections between the characters mentioned in the novel, this analysis tends to study the function of characters in the novel and the general structure of the novel and present them visually through network graphs.
Critique
This idea of using network analysis on fiction has been explored by many others. This visualization made by Martin Grandjean in 2015 was on the characters in Shakespeare’s plays. Two characters are connected is they appear in the same scene. Such a map, along with its associated data analysis, presents the popularity of a character in the play and its functionality as indicated by presence. This is a very colorful graph, but I think it goes contradict to the topic of Shakespearean’s tragedy, and I would choose a darker color instead.

Materials
Data: from Gephi Wiki
Gehpi: Network Analysis tool
Methods & Process:
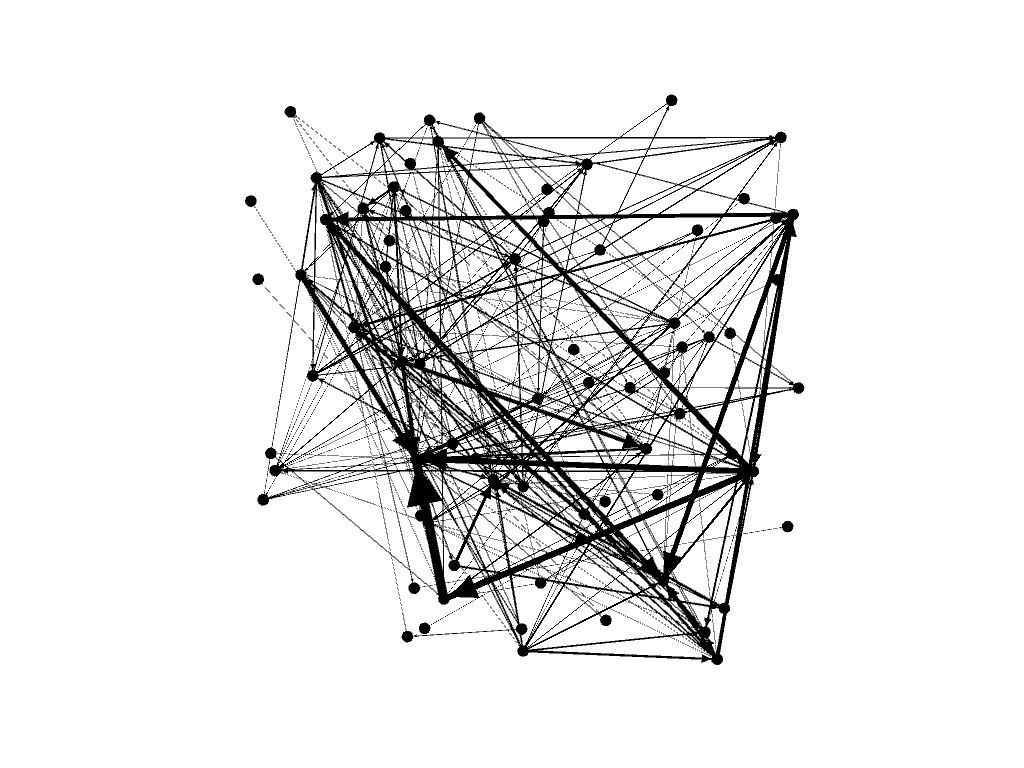
The graph is originally like this. Then I apply ranked sizes and gradient to the graph according to the measurement of In-Degree and Out-Degree. The color is selected from the book cover, representing the miserable experience of Paris people.

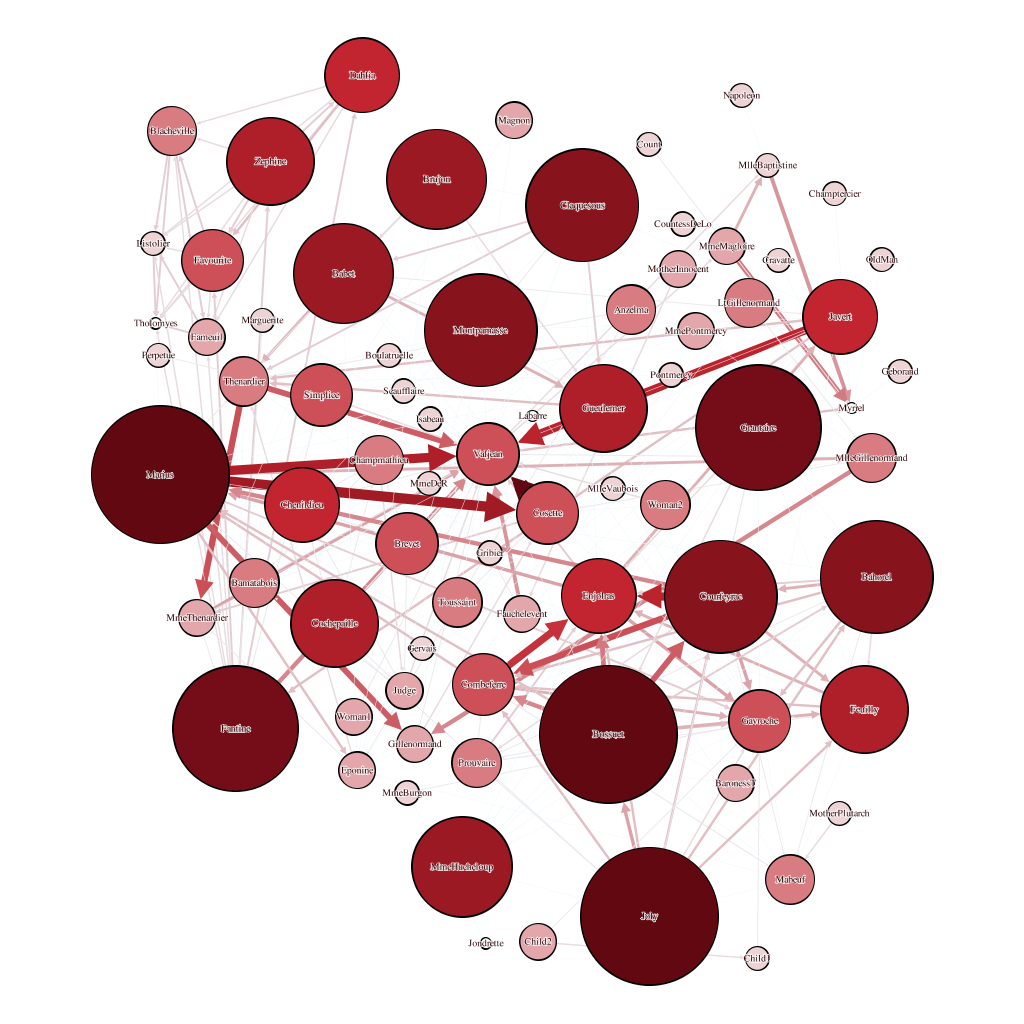

Then, I felt like it would be more obvious if I can put these two dimensions of information onto the same graph.
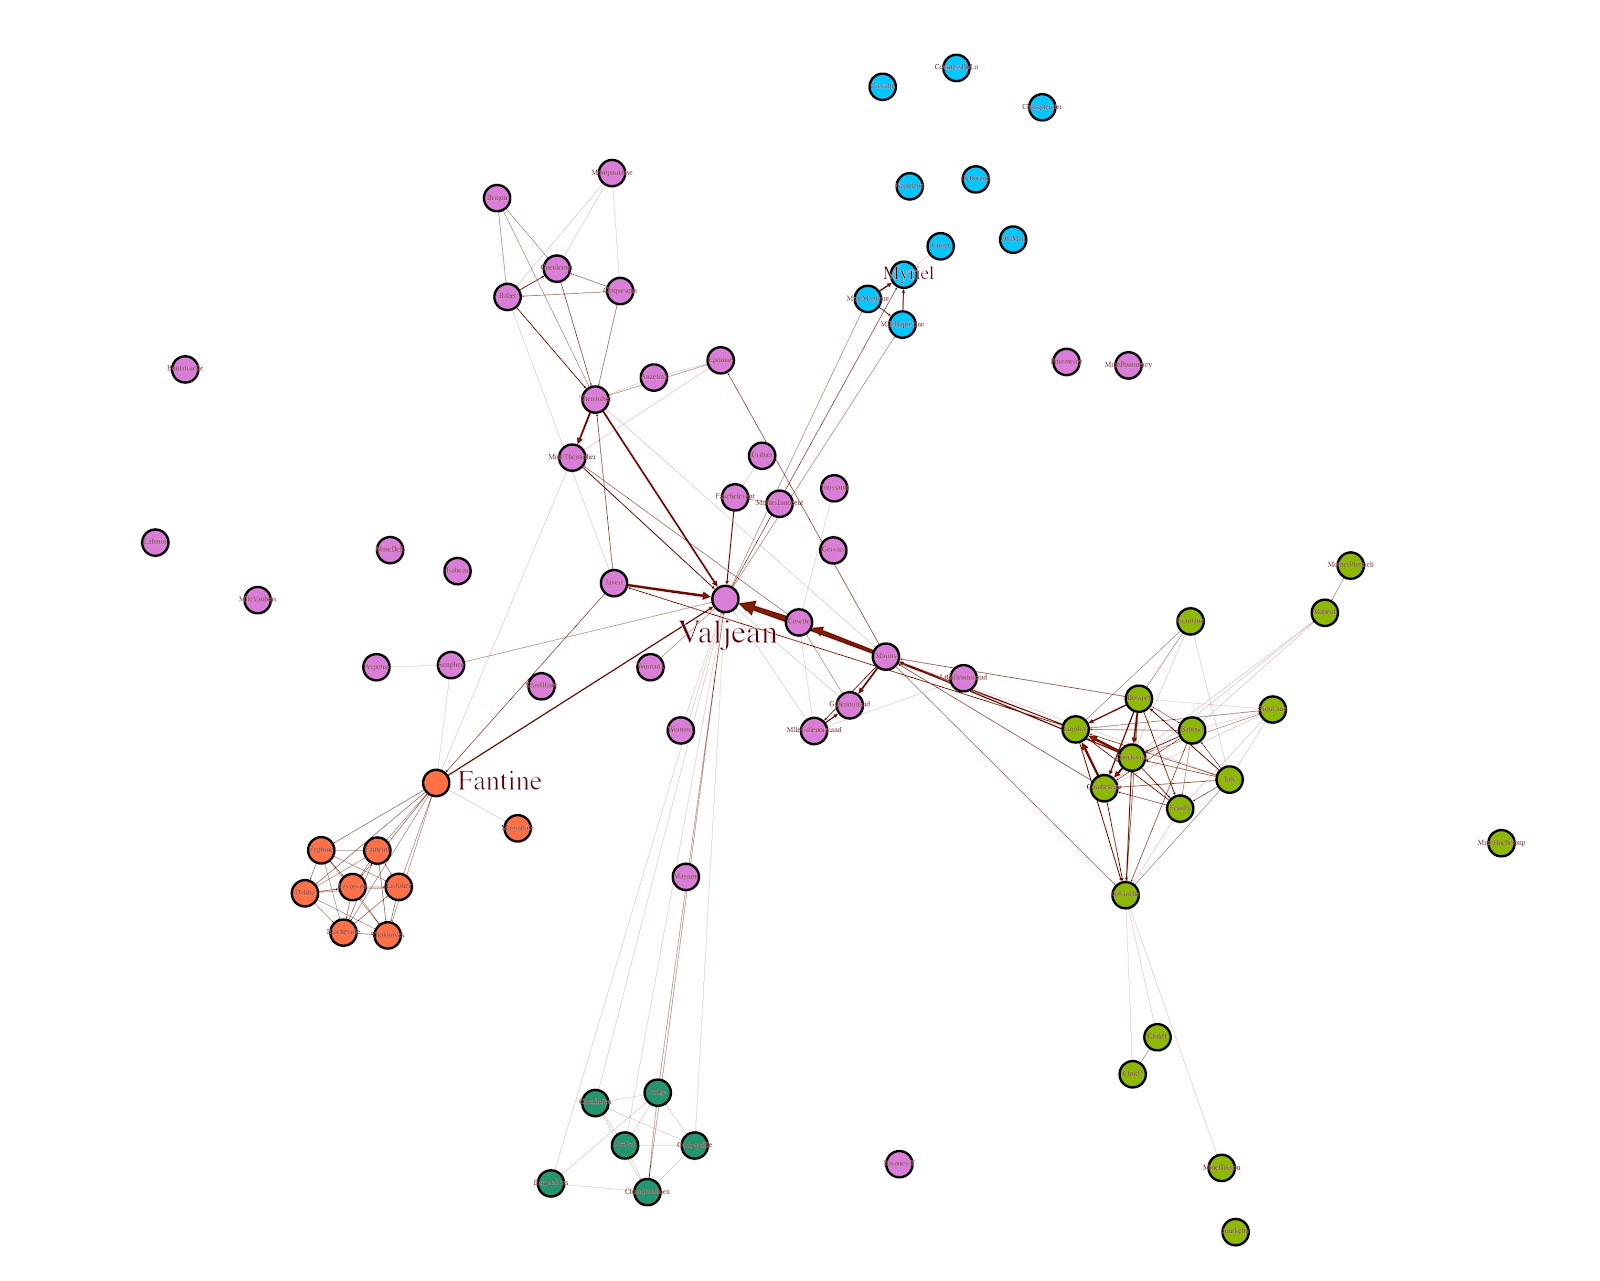
Through measuring Modularity, I colored the nodes into five sections.
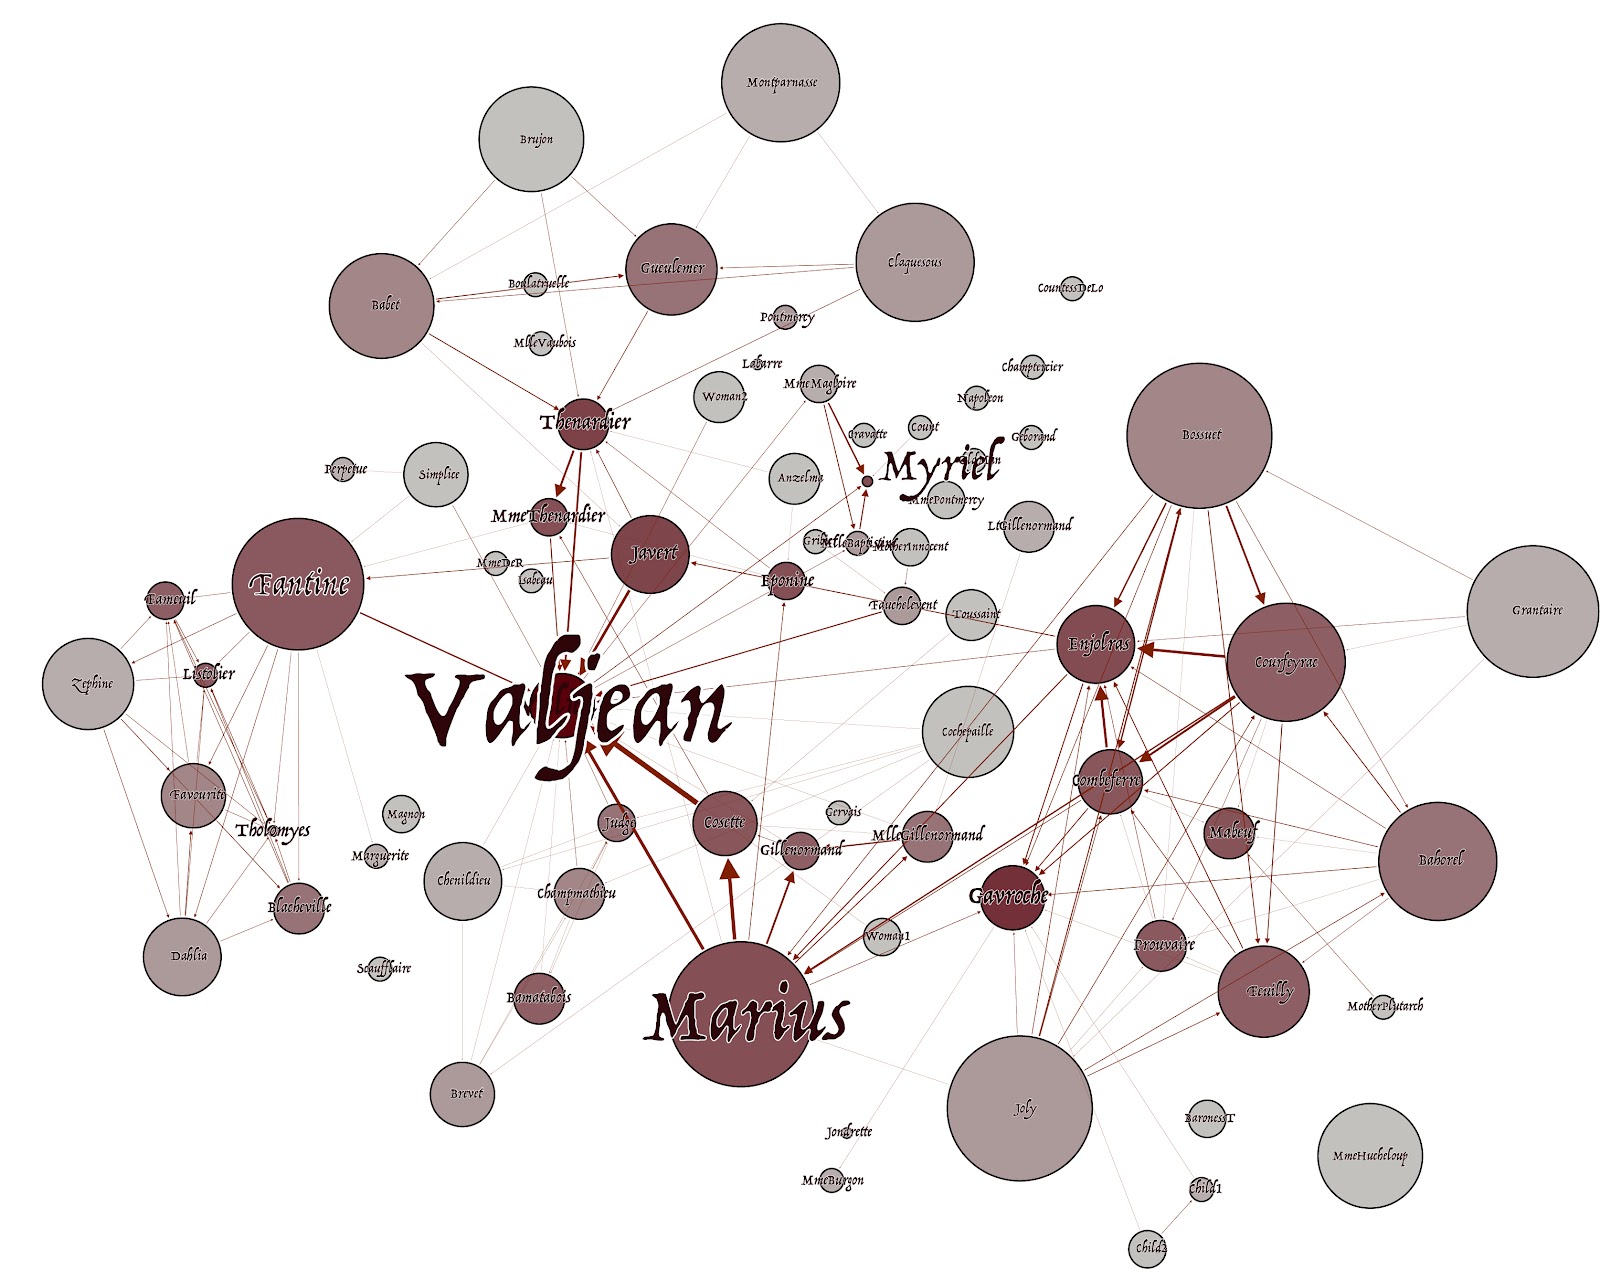
And finally, as a summary, I made a traditional sphere graph focusing on the overall connection mentioned in this novel..


And I also tried a star which can integrate all the information in one.
Results
Comparing the in-degree and out-degree, it is not difficult to figure out that Valjean is the most central character in this novel. It is the most inward connected character (darkest color), which means everything and every one is somehow related to him. On the contrary, Valjean is not too much outward related (the circle is not too big), which means, his own story does not involve too many others, comparing to Marius, the most outward connected character. Another point that is interesting on this graph is Myriad, he is as significantly inward related (as dark as Valjean), but not at all outward related (smallest circle among all). This character is thus “functional.” It is the agent of the author and is used to guide the general direction of the plot, where the character itself is not so important.

Les Misérables has five major groups, major characters lead by Valjean, secondary characters lead by Fantine, assisting characters, lead by Myriad, complementary characters like Bossuet, and minor characters lead by Mme Magloire. They serve different functions in the novel and together make the story real and moving.

Reflections
Network analysis is a fast and effective way to understand the general structure of a novel. Though it requires the actual content to make sense of it, such a presentation serves as a good visual stimulus that attracts attention. With further development, such a network analysis can be used to present more complicated stuff like the actual plot of a novel, the level of summarization can go down as long as the dataset supports.