Introduction
According to usfa.fema.org, there were over 1.3 million fire incidents in the United States. Learning of this, I was curious about where these fires were located and how did those fires start. I began to research more information and searched for datasets that I can use to visualize this information. I found a dataset from ArcGIS hub, that has some data on some of these fires. As a disclaimer, this dataset doesn’t show the 1.3 million incidents but it does give a rough idea of some of the areas that were affected by fires.
Methods
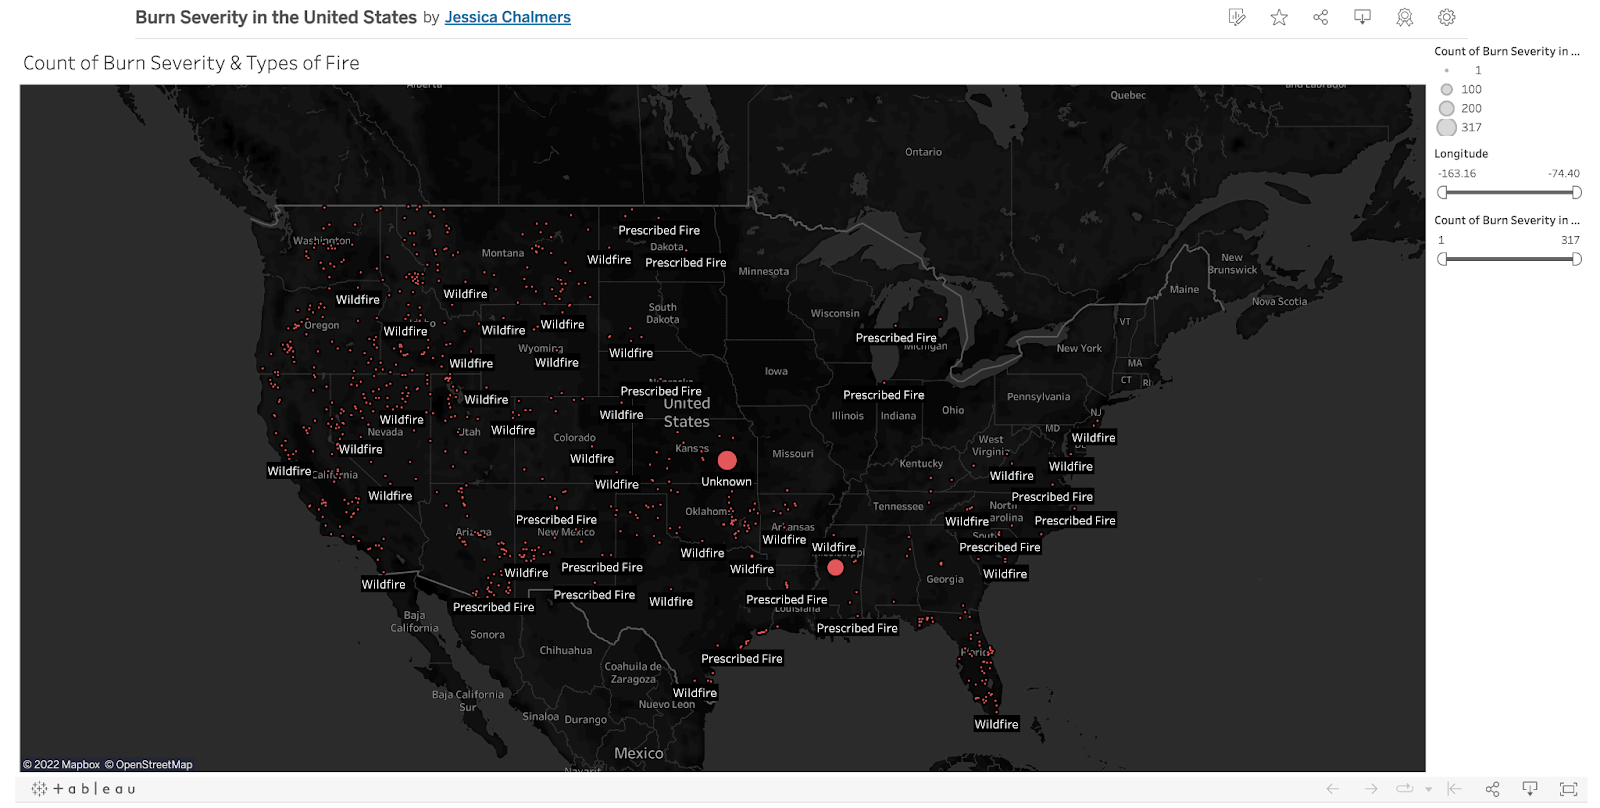
Once I found the dataset from ArcGIS, I downloaded the CSV file and uploaded it to Tableau. For the columns, I put the variable longitude and for the rows, I put the variable latitude. Then, in the details section, I added the Fire Name, and in the labels section, I added the Fire-type. I did it this way instead of reverse because I felt knowing the type of fire was more beneficial than the name of the fire to know what caused it. Also, on the map, I chose to do the round circles for the size and the color red. The red emphasizes the alert or urgency of the areas affected by the fires. And, I changed the layout of the map to a dark color so that you can see the red circles boldly.
Results & Interpretation
This visualization gives a quick look at what areas in the United States were affected by the fire occurrences in 2017.
Link to Tableau Public: https://public.tableau.com/app/profile/jessica.chalmers6653/viz/BurnSeverityintheUnitedStates/CountofBurnSeverityTypesofFire
Here are some findings:
- Kansas and Mississippi have the highest fire occurrences of more than 200.
- West, mid-west, and south coasts with the exception of Mexico had more fire occurrences than the east coast.
- There were more wild fires.
Reflection
Working on this geographical map in Tableau wasn’t so bad. The difficulty I had was finding the dataset that would be best for this assignment. An opportunity that I realized I could’ve done was change the colors of the circles based on the number of fire occurrences so it doesn’t show red everywhere. However, I wasn’t sure how to do that.