INTRODUCTION

Toilet paper seems to be a very common household consumer product, and we use it every single day without valuing its importance. Recent COVID-19 pandemics had led a panic buy in toilet paper across the globe. Back in China 30 years ago, we didn’t have access to any toilet paper, but today is an essential product in every family. In fact, a large amount of the population still doesn’t use toilet paper in our world. I decided to create a data visualization project regarding the consumption of toilet paper worldwide, in the time range from 1961 to 2018.
TOOL AND MATERIALS
In this project, I used data from UNdata, a global database provided by the United Nations (UN) statistical system and other international agencies. I searched and downloaded two datasets:
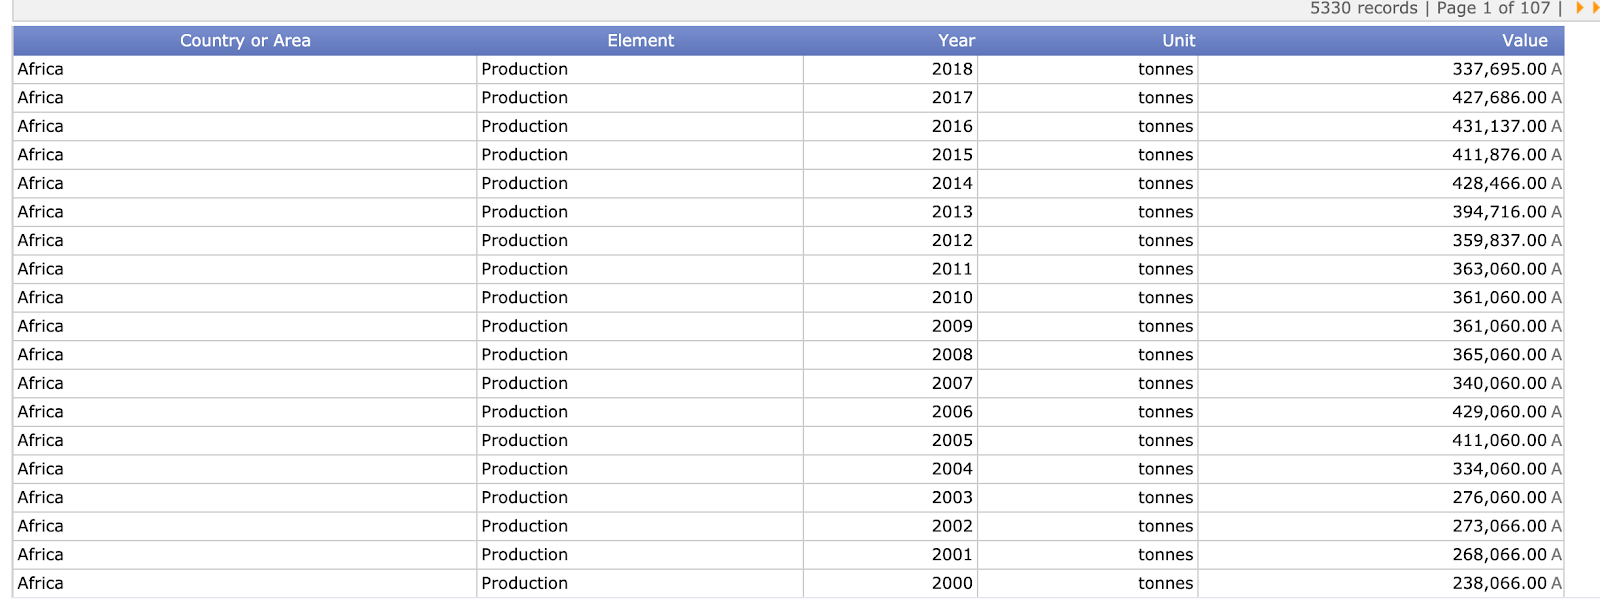
1.Household and sanitary papers, which includes the amount of production, import and export quality of household papers of different countries from 1961 to 2018.
2. Total population, which shows the population of each country in that specific time span.
I used Openrefine and Tableau Public, two open-source tools to clean my data, do calculations, and make a visualization.
PROCESS
I had three attempts in this project and familiarized myself with the tools and techniques of data visualization.
Attempt 1:
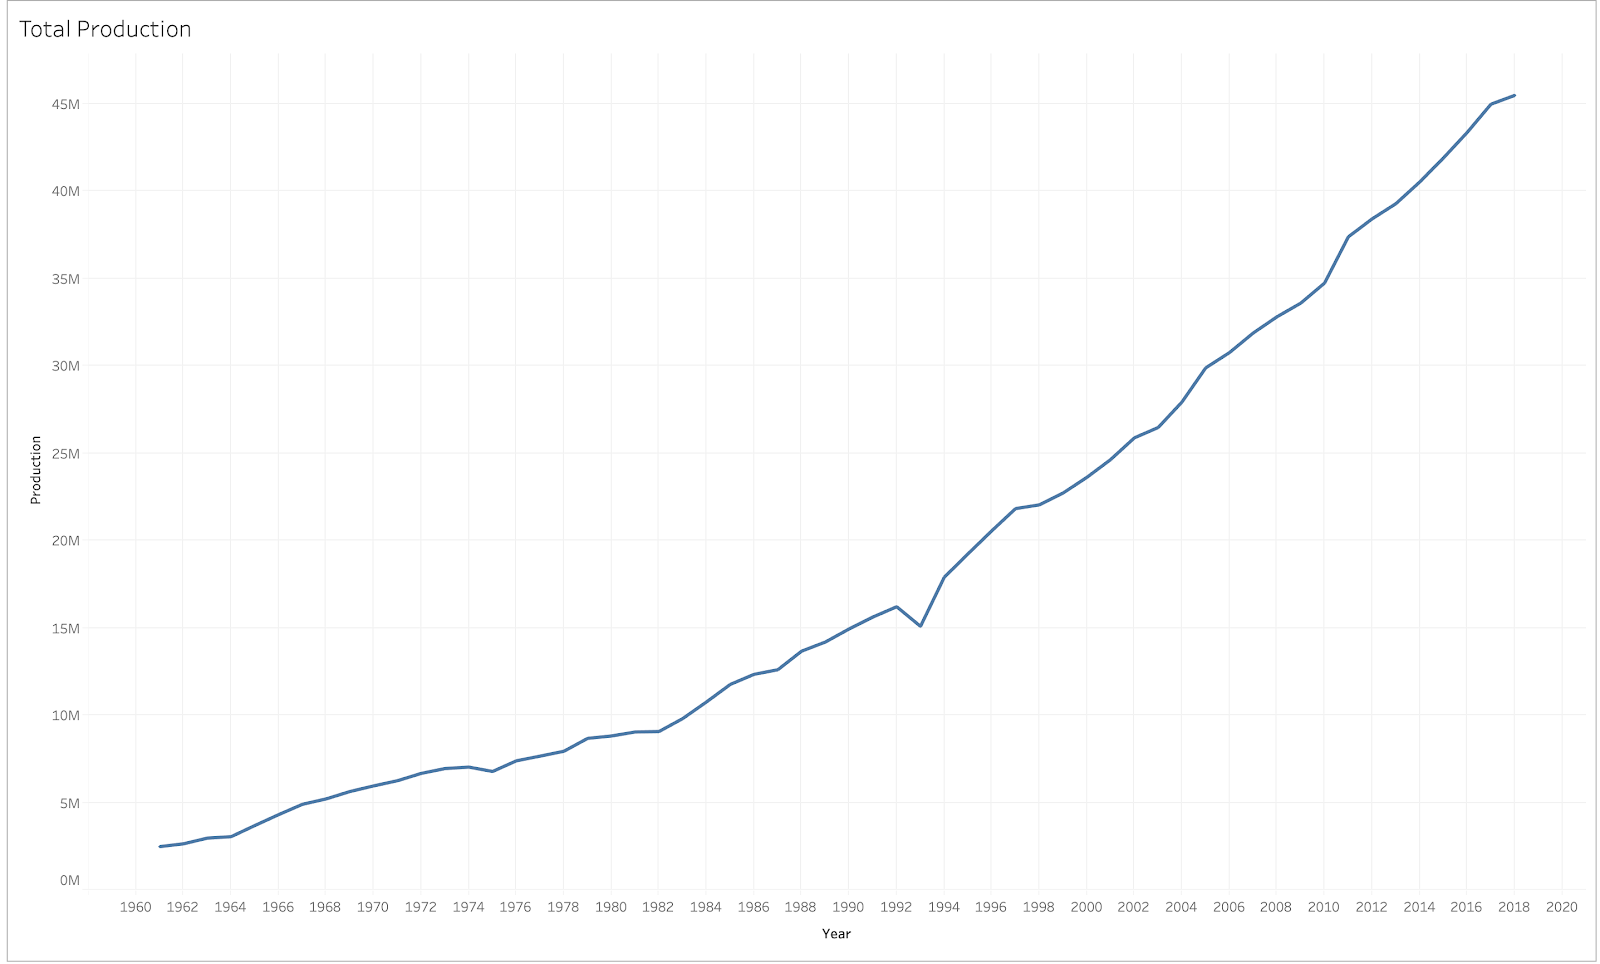
I downloaded the Household and sanitary papers dataset from UN data and imported it to Tableau Public.
I used the sum of production as rows, and year as columns. The line chart shows the total consumption changes of household paper in the last 60 years in our world.
Attempt 2:
Rather than total production, I want to have a direct view of toilet paper consumption of each country. I need to do more with my dataset so I imported the raw data into Openrefine. This allows me to reorganize the data by country and year.
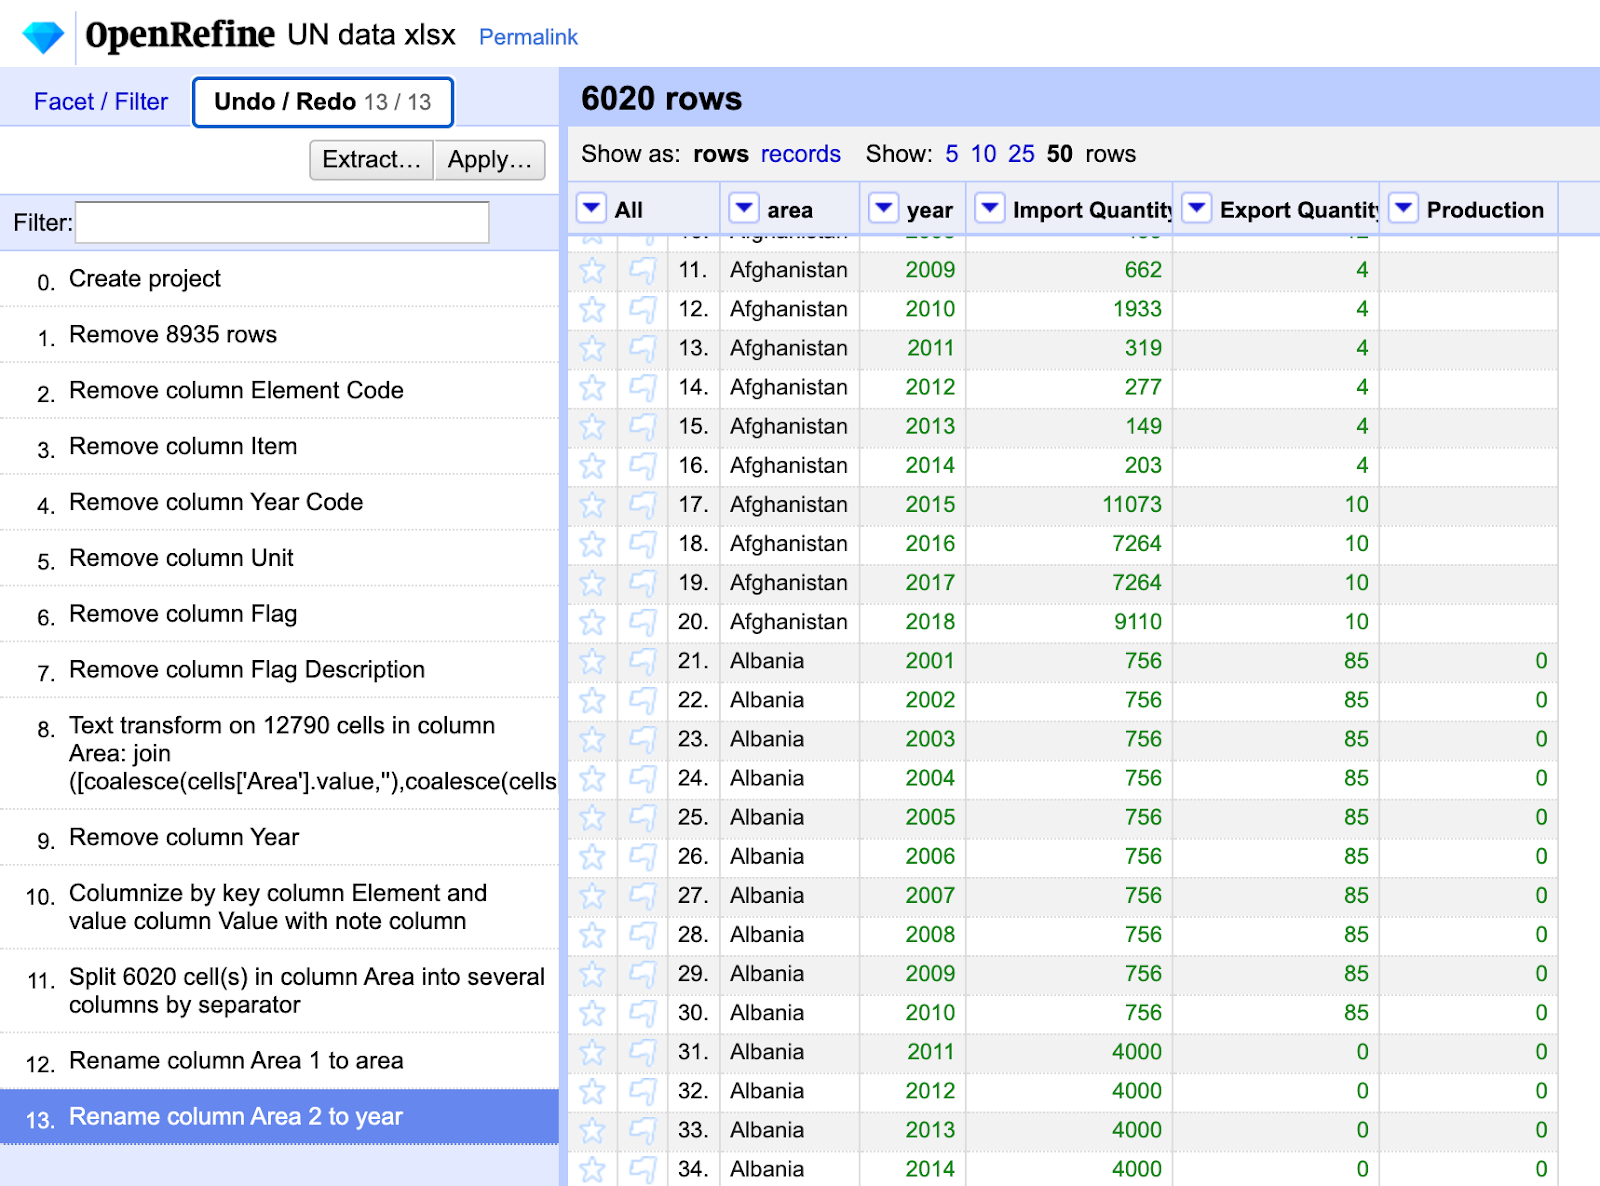
I imported the new dataset into Tableau Public and calculate the consumption by the formula:
Apparent Consumption = Domestic Production – Exports + Import
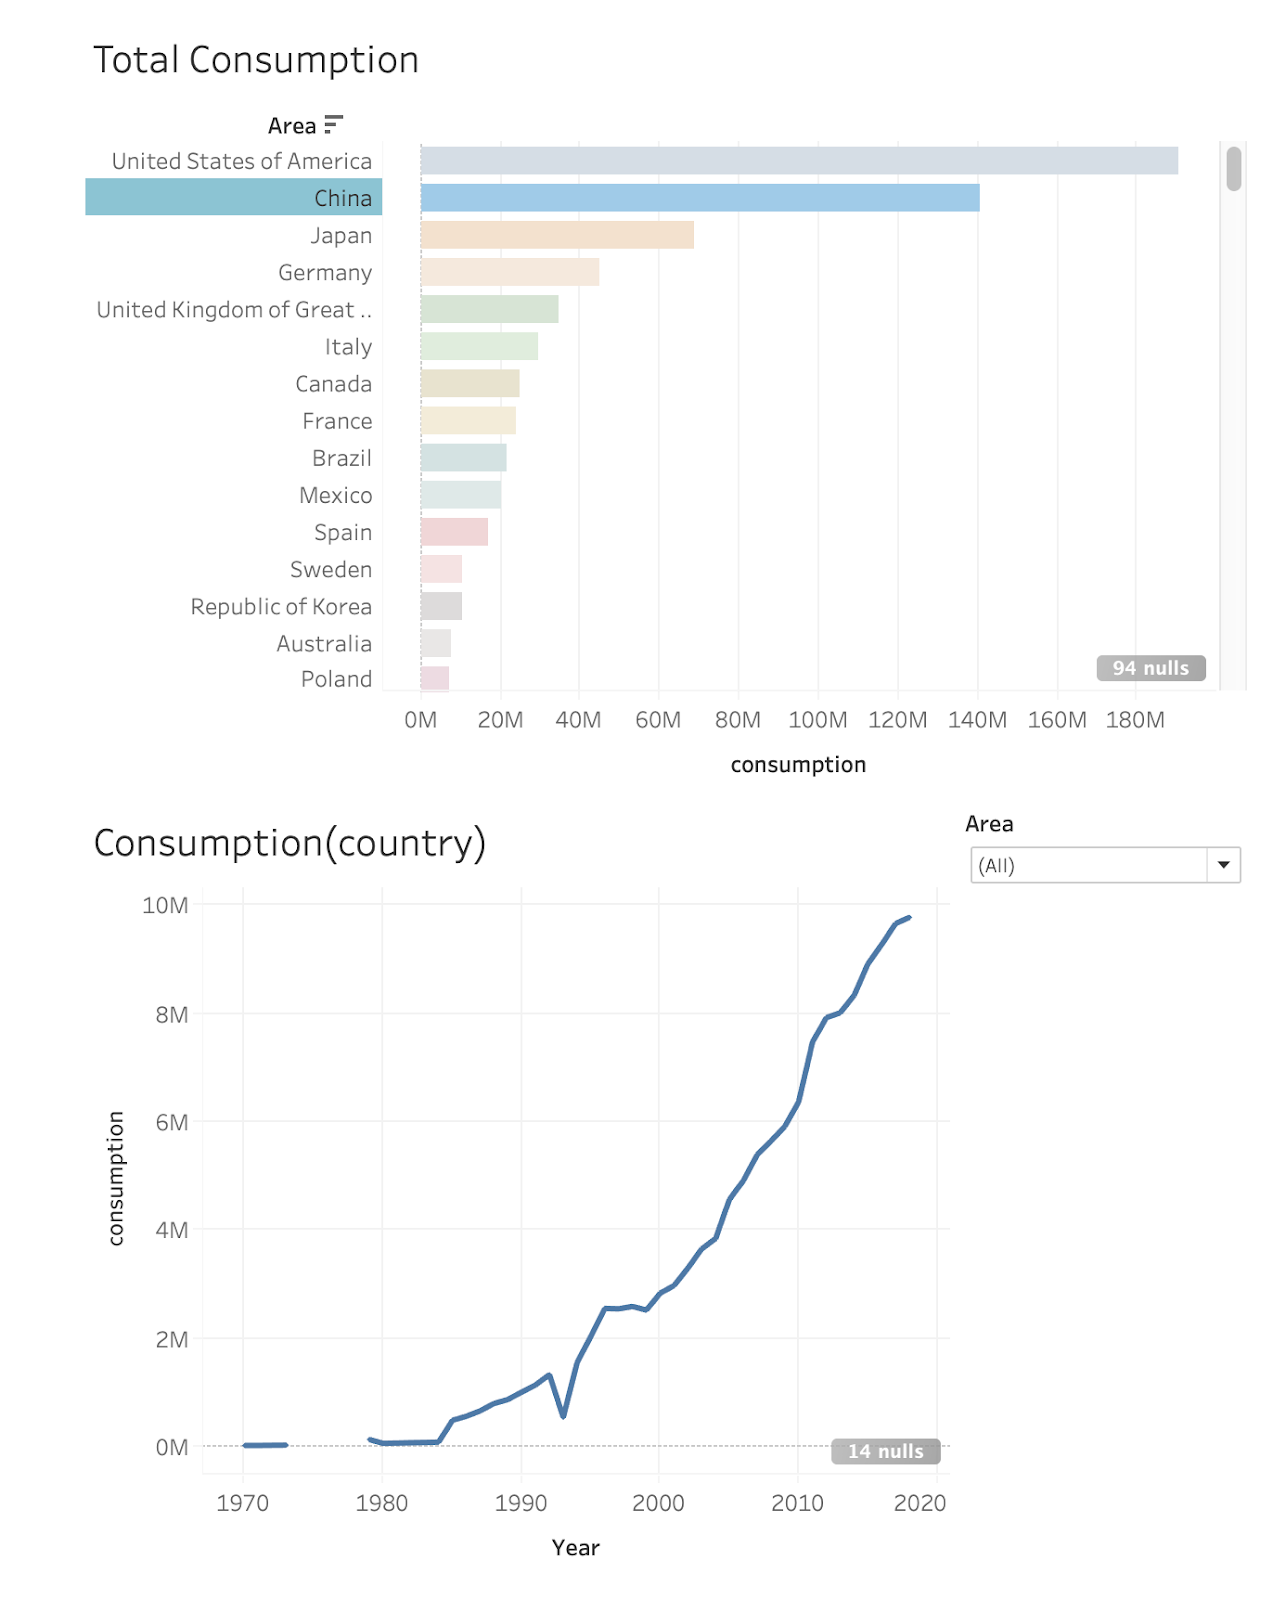
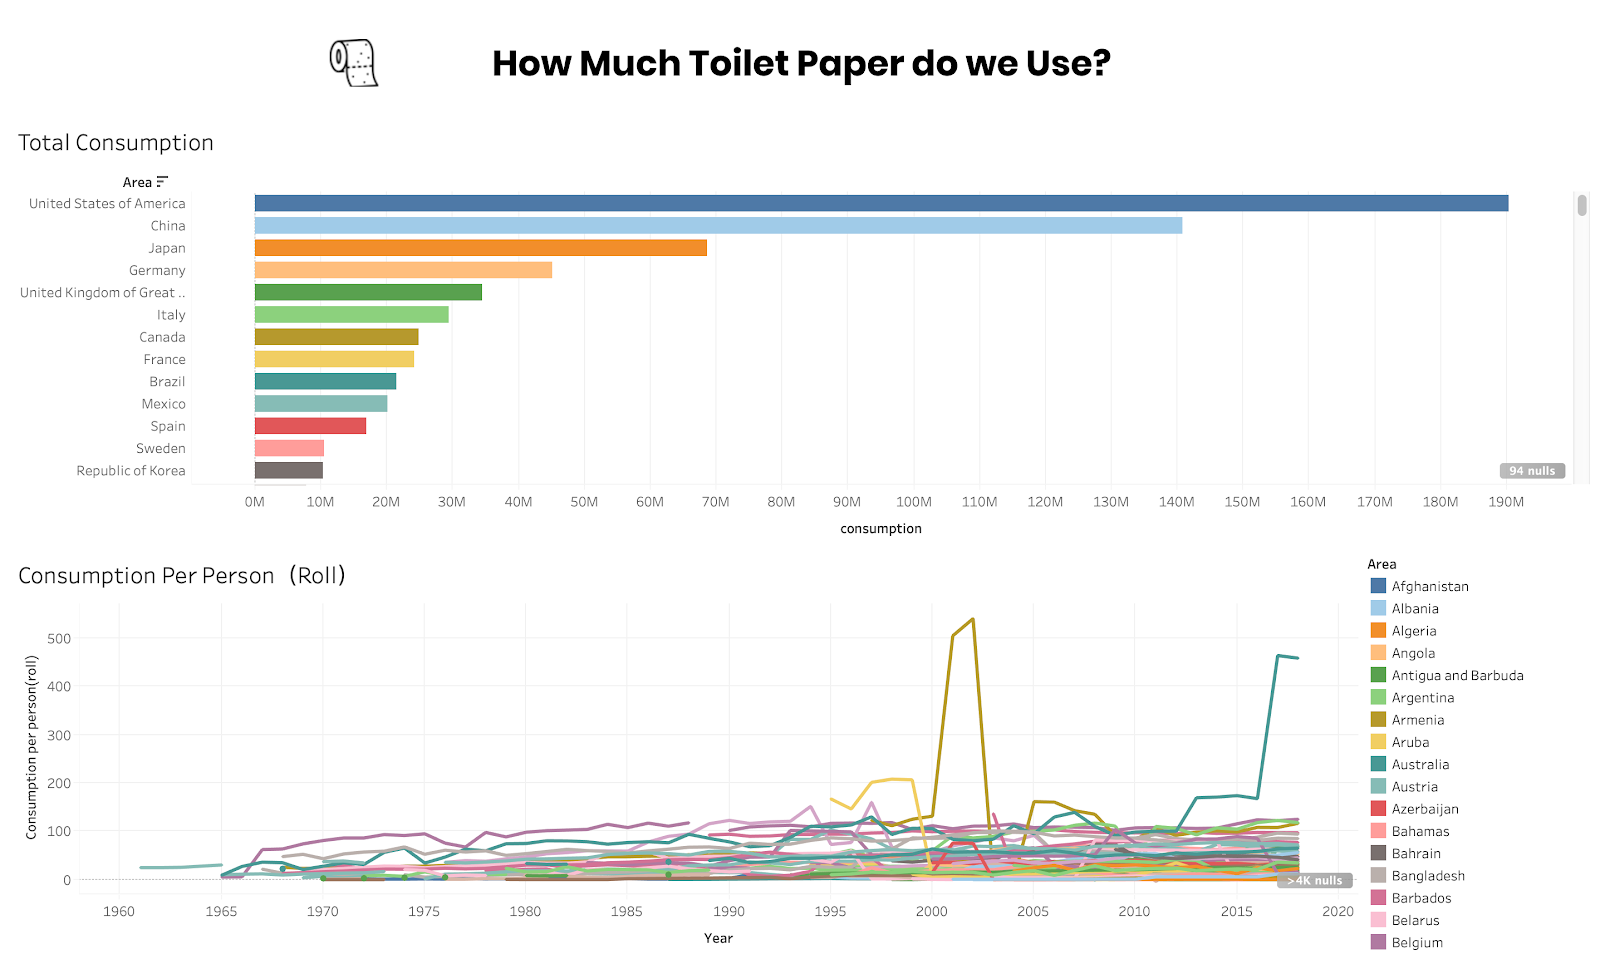
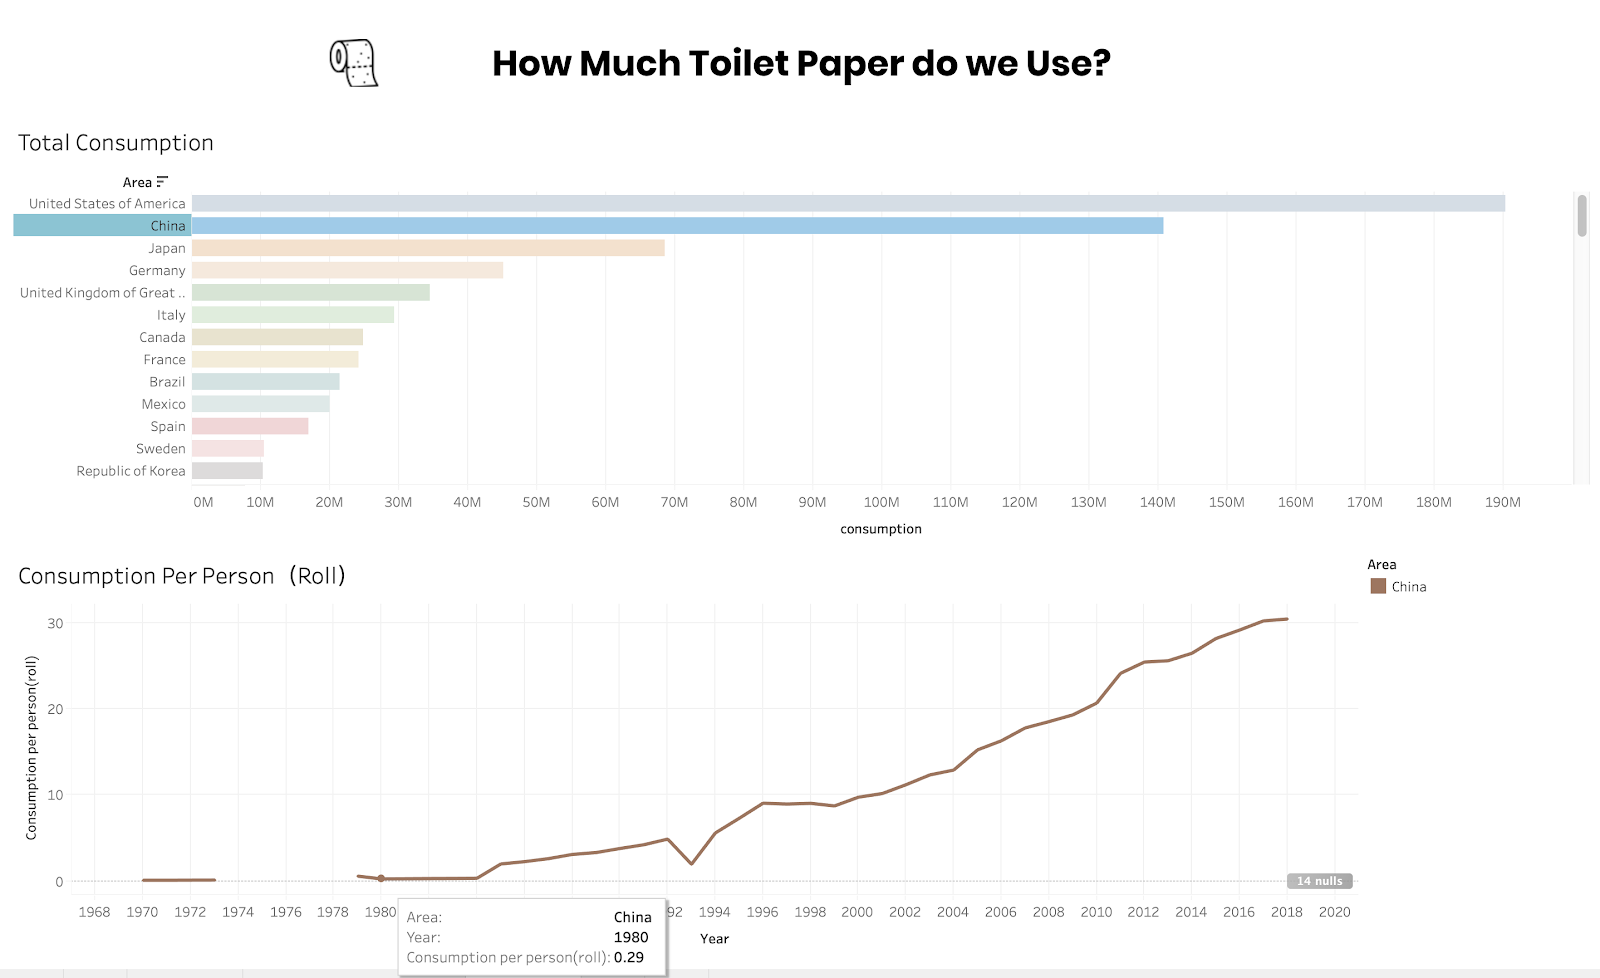
With the data of consumption per year, I recreate the visualization. I used a Histogram to show each country’s consumption from largest to smallest. The graphic is also a filter that could be selected to view a historical change of paper consumption in that country.
Attempt 3
After finishing the second visualization, I realized that the unit of this sheet is tones, which is unfamiliar to most of us. I decided to make my data from macrocosm and microcosm to let users better understand it. People can easily imagine the weight and size of a paper roll. The paper roll could be a wonderful “unit” on my sheet. First, I need to show the data on consumption per capita rather than total consumption. Second, I need to change the unit from tons to grams, then calculate it to the amount of rolls.

I introduced a new dataset, population, and merged it with the original data in Openrefine. I updated the new dataset in Tableau and used the original value divided by 227 grams, an average weight of paper roll to see the amount of rolls.
Eventually, I made my new graphic to show how many rolls people use in a year.
Results & discussion
The final result of my visualization has two charts. The first one shows the total consumption of toilet paper in different countries. We could see that the United States of America, China, Japan, Germany, and the United Kingdom are the biggest consumers of toilet paper in the past 60 years. On the other hand, countries like Tajikistan, Uzbekistan, Seychelles, Montenegro, Madagascar, Iceland have very little consumption. The second one shows each country’s per capita consumption. Take China as an example. In the 1980s, Chinese used only 0.29 rolls of toilet paper in a year. But in 2018, one person can use 30.45 rolls of toilet paper.
Reflection & Future Direction
My first trial in data refine via OpenRefine and data visualization via Tableau have been a success and I had a great time playing around with all sorts of visualization methods. Initially, I was struggling with the performing calculation in OpenRefine but in the end, I sorted it out. As I visualized my refined data there was some country data that looked odd, still unclear after some research, but I kept using the UN official data to keep the overall consistency.
OpenRefine and Tableau both are powerful tools, but less friendly to new users in my perspective. The user has to possess a strong sense of logic and knows precisely what he/she intends to do. I had trouble using both software before I consulted with my professor, but everything was fine after I attended the tutorial session.
If I were to work further with this project, I would wish to visualize my dataset using icons, it would be easier and fun to read rather than plain line graphs or bars. In addition, I would also introduce new data sets for references, such as adding current GDP rates or forest coverage percentage, checking any possible intercorrelation.
References:
http://data.un.org/Data.aspx?q=paper&d=FAO&f=itemCode%3a1676
http://data.un.org/Data.aspx?q=population&d=PopDiv&f=variableID%3a12
Great job alina!