Introduction
In 1964 The Wilderness Act was passed, ensuring that wilderness areas would be set aside to benefit generations of Americans to enjoy the natural beauty of the United States. Since then, these parks have invited countless visitors within their borders and are home to many of the animal species which inhabit the country. In particular, out of the 1,107 bird species in the United States, many can be found within the National Park system.
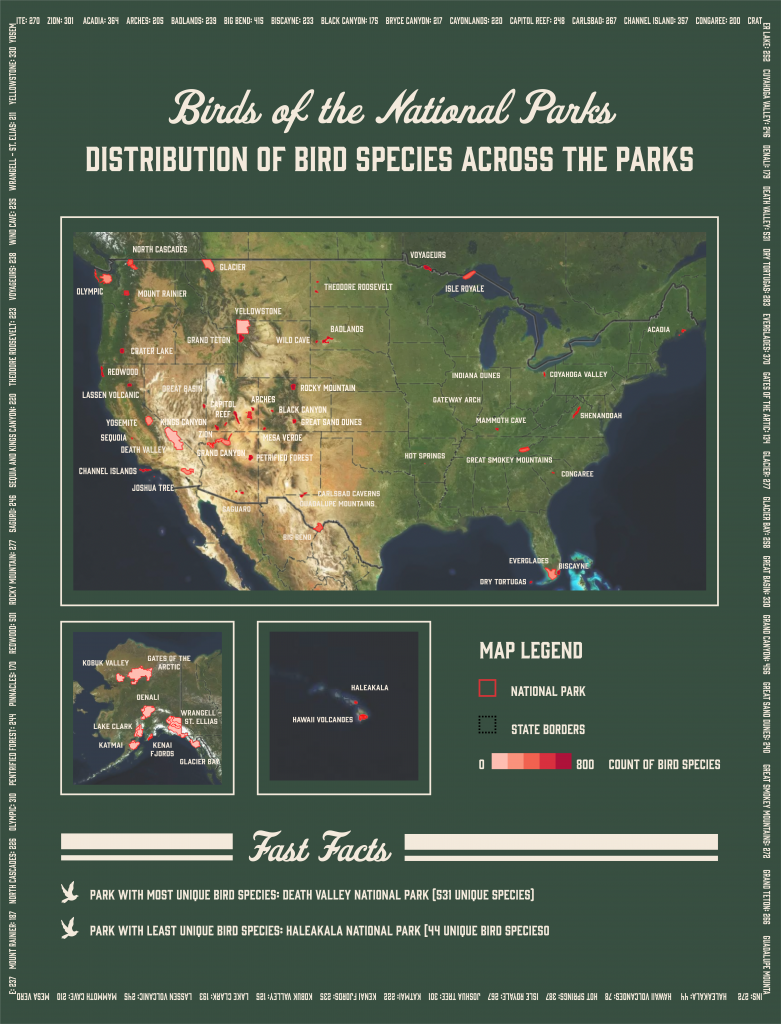
This data visualization attempts to communicate this distribution of bird species throughout each of the country’s National Parks and provide potential visitors and birding enthusiasts the information they need before planning their next trip.
Getting Inspired
Never having worked with geospatial data before, I sought inspiration in order to inform what project topic I would focus on. Once I had narrowed down the possibilities to focus on National Parks, I searched for inspiration and found the following map — which would serve as my guide and casual tutorial throughout the remainder of this assignment.

The data visualization above communicates how far the country’s 61 National Parks are from major population centers. One of my favorite parts of the visualization is how effectively I believe it highlights the parks as it was challenging to make them stand out when they are so much smaller in area when compared to the rest of the country. In addition, I was inspired by the stylization and decided to challenge myself to create something similar, assigning myself the task of creating my own visualization that felt as though it was part of the same brand system.
The Process
- Acquiring the Data
My first step was finding the data that would be appropriate for this assignment. For this, I turned to the government website for the national park service and downloaded the open data available there. Once the spatial data was acquired, I used Kaggle in order to add a quantitative dimension. The dataset I chose was one which contained two CSV files – one listing park information (park code, acres, latitude, longitude) and one containing all unique species found in the parks.
2. Processing the Data
In order to work with this data, I first merged the two CSV files. My first step was filtering the species dataset to only include unique bird species – filtering out mammals, fish, and plant species. After this process was complete, I merged it with the park dataset by creating a column to contain the number of unique bird species found in each National Park. Before this data could be brought into Tableau, I normalized the count of bird species by dividing it by the size of each park.


3. Creating a Geospatial Data Visualization
Once both the geospatial data and the CSVs were organized, I brought both datasets into Tableau. It was decided that Tableau would be used since the newer release of the platform Carto did not allow for CSV files to be processed. Before a map could be made, the geospatial data files were joined with the CSV by connecting the UnitCode column on the geospatial data with the Park Code column on the park CSV file. Once this was done, a map was made outlining where National Parks exist on the map of the United States. After this was done, colored this area by the normalized count of bird species that exist in each of the National Parks. One challenge I faced was making this area stand apart from the general map as National Parks represent only a small fraction of the country’s total landmass.

To overcome this challenge, I turned to my inspiration and learned that the color red might work to draw attention to the parks. In addition, I added a border and glow to the park area in order to further offset it.

4. Stylizing the Map
Although I was happy with how the map looked in Tableau, I wanted to further stylize the map and additional information to the visualization. For this, I brought the map into Adobe Illustrator – separating by the continental United States, Alaska, and Hawaii in order to present a more zoomed in version of the map. Additionally, I added a key to the map and provided a series of quick statistics about the national parks that have the most and least unique bird species. Because this map was going to be presented as static, I decided to include labels to the National Parks as not many individuals are familiar with which parks exist where. The finished version of the visualization achieved my goal of following the brand guidelines set by my inspiration.
Reflection
Although I’m really happy with how this visualization came out, in the future I would like to experiment with different styles in order to make it easier for viewers to compare the number of bird species that exist in the different parks as it becomes challenging when comparing across a large amount of geographical space. In addition, I would like to interview users to see what other “fast facts” they’d want to see. I think if I were to take this project a step further, the poster could be aided by including different types of data visualizations – such as a bar graph to show the counts of unique bird species in each park or a scatter plot to show some of the different species.