
Figure 1. Final – Marvel Social Network
introduction
For the GEPHI lab I decided to work with a large dataset, the Marvel Social Network available from the GEPHI wiki (https://github.com/gephi/gephi/wiki/Datasets). I am fan of Marvel and thought working with this dataset would be interesting as I am familiar with the groups represented by this social network. My intentions were to clearly represent the social relationships within the network and show the clustering of large Marvel groups such as the Avengers, X Men, Guardians of Galaxy, etc. using color.
inspiration

Figure 2. Marvel Avengers Promo Poster
Since this is a network based on an entertainment franchise, I wanted to express that in my visualization by doing something dramatic with the colors and working within the color scheme of Marvel, see Figure 2. Therefore I went looking for examples that specifically used dark backgrounds and rich, but simple color to show the node clusters. I found several good examples, but I particularly like the transportation clusters visualization by Dr. Martin Grandjean, Figure 4. His website http://www.martingrandjean.ch was very helpful and incredibly inspiring for this lab. His tutorials are great and he is obviously very comfortable with the software and is able to produce beautiful and informative visualizations. I found GEPHI to be a bit of a beast and I must admit, I was unfamiliar with many of the new terms used in the software. Each lab we have completed each has almost felt as if I was learning a whole new language in addition to to the software itself! My third inspiration example was a viz I found on Katherine Ognyanova’s, Assistant Professor – School of Communication a

Figure 3. Nodes representing people, organisations and productions tagged with a filming location in North East England in the IMDB
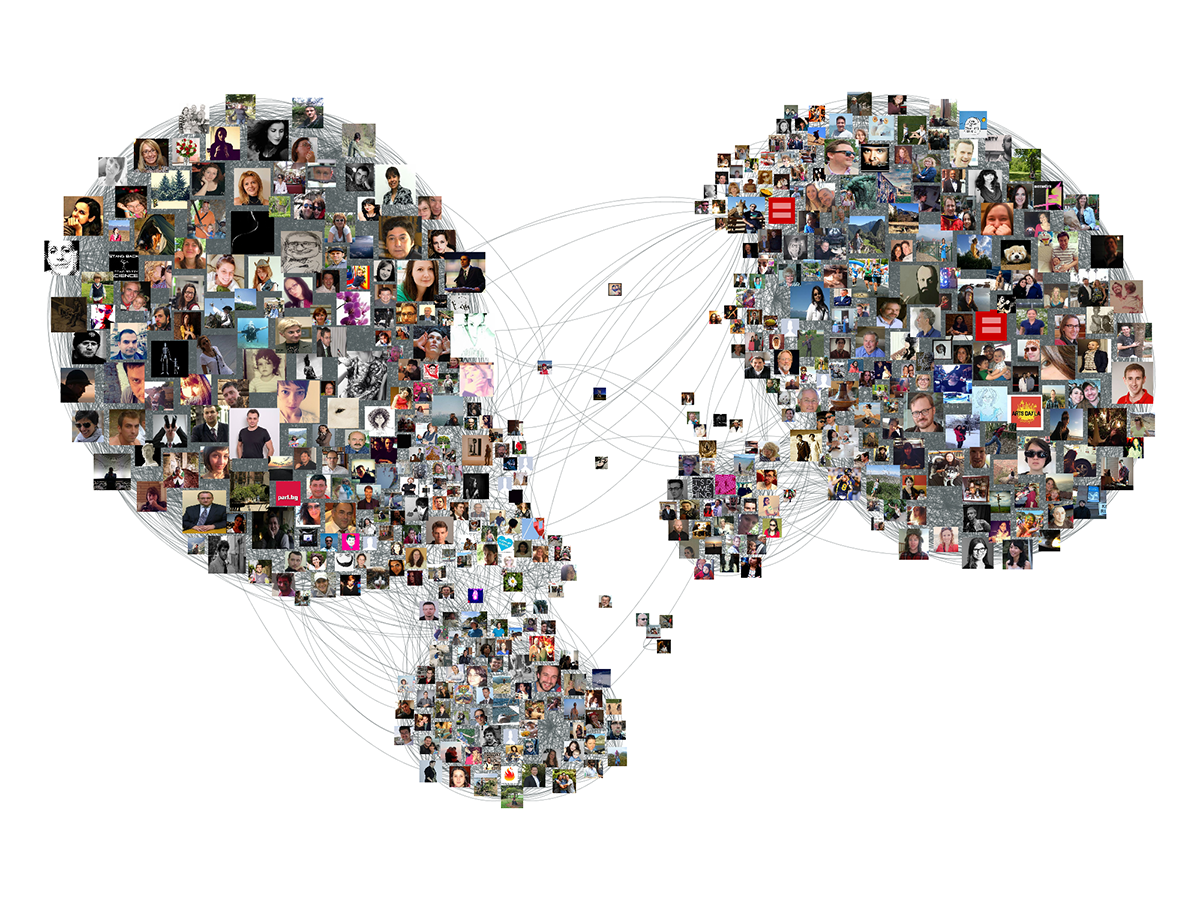
nd Information at Rutgers University, website (http://kateto.net) where she used photos as the nodes in her Facebook social network visualization, see Figure 6. This use of alternate node representation is something that I would have like to have done with this dataset, though I am not sure with such a large group of nodes (6K+) it may have looked far too messy. Fortunately, I did not reach that point in my exploration of GEPHI and will have to save that for future directions. As with the website of Martin Grandjean noted above, Katherine Ognayanova was also a treasure trove of information, tutorials, and examples of fantastic data visualization.

Figure 4. World Transportation Clusters
software and datasets
For this lab I used GEPHI version 0.9.2 installed on my laptop. I perused the datasets on the GEPHI wiki before finally settling on the Marvel Social Network.
methods & results
The Marvel Social Network file was already in a GEPHI file format which made opening the file in GEPHI incredibly smooth and easy. The dataset is large with nearly 6.5K nodes and GEPHI is a memory hog of a software product, so my first attempts to work with the data was encumbered by the software’s continual freezing and crashing. After a brief consultation on how to change memory allotment for GEPHI on my computer (thank you Dr. Sula), I made the changes necessary and continued my work. My first action was to chose a layout, Force Atlas, and then run Modularity. From here I began to work the appearance of my viz by changing the colors, background to black, edges to red by weighted ranking. I then chose to partition my nodes by modularity class and use a blue/grey palette to reflect the Marvel color scheme. It was only after this node modification that I was finally able to see the clustering of prominent groups such the Avengers, X Men, Fantastic Four, etc. I am generally quite happy with my first viz in GEPHI.

Figure 5. Detail of Marvel Groups/Clusters
future directions
As I noted above, I think it could have been interesting to use images as nodes, though I do still have reservations that such a large social network could look really messy and overwhelming. I have learned throughout this semester that having ridiculously high expectations for my first attempts often leads to frustration with the less than stunning results. I would like to continue working with GEPHI and explore animated visualizations as well as hypergraphs.

Figure 6. Facebook data collection and photo network visualization with Gephi and R
references
https://github.com/gephi/gephi/wiki/Datasets
https://www.martingrandjean.ch
https://visualisingadvocacy.org/node/615.html
http://www.martingrandjean.ch/connected-world-air-traffic-network/
http://kateto.net/wp-content/uploads/2015/04/Facebook-friends-net-GEPHI-Images.png