Information Visualization

Student work at the School of Information, Pratt Institute

Menu

Skip to content
  • Final Projects
  • Lab Reports
    • Charts & Graphs
    • Maps
    • Networks
    • Timelines
  • About
  • |
  • Login
  • Help

Lab Reports

Use Gephi to present the metal world trade in 1994

Hanyu Zhang

Visualizing Ingredient Networks

dgallomc

From Treemaps to Network Graphs: Further Visualizations of Hierarchical Relationships in The Art Genome Project

regan

Visualizing the Content of Science Fiction with Gephi

Elise Fu

Info Vis Lab 4: Gephi

kcosenza

Planting Companion?

rrichar9
Paston letters network, with nodes colored by modularity class and weighted by letter output, edges colored by type of relationship and weighted by number of directed relationships between two individuals.

Revisiting the Paston Letters Network

heathervhill
Network graph showing nodes and edges

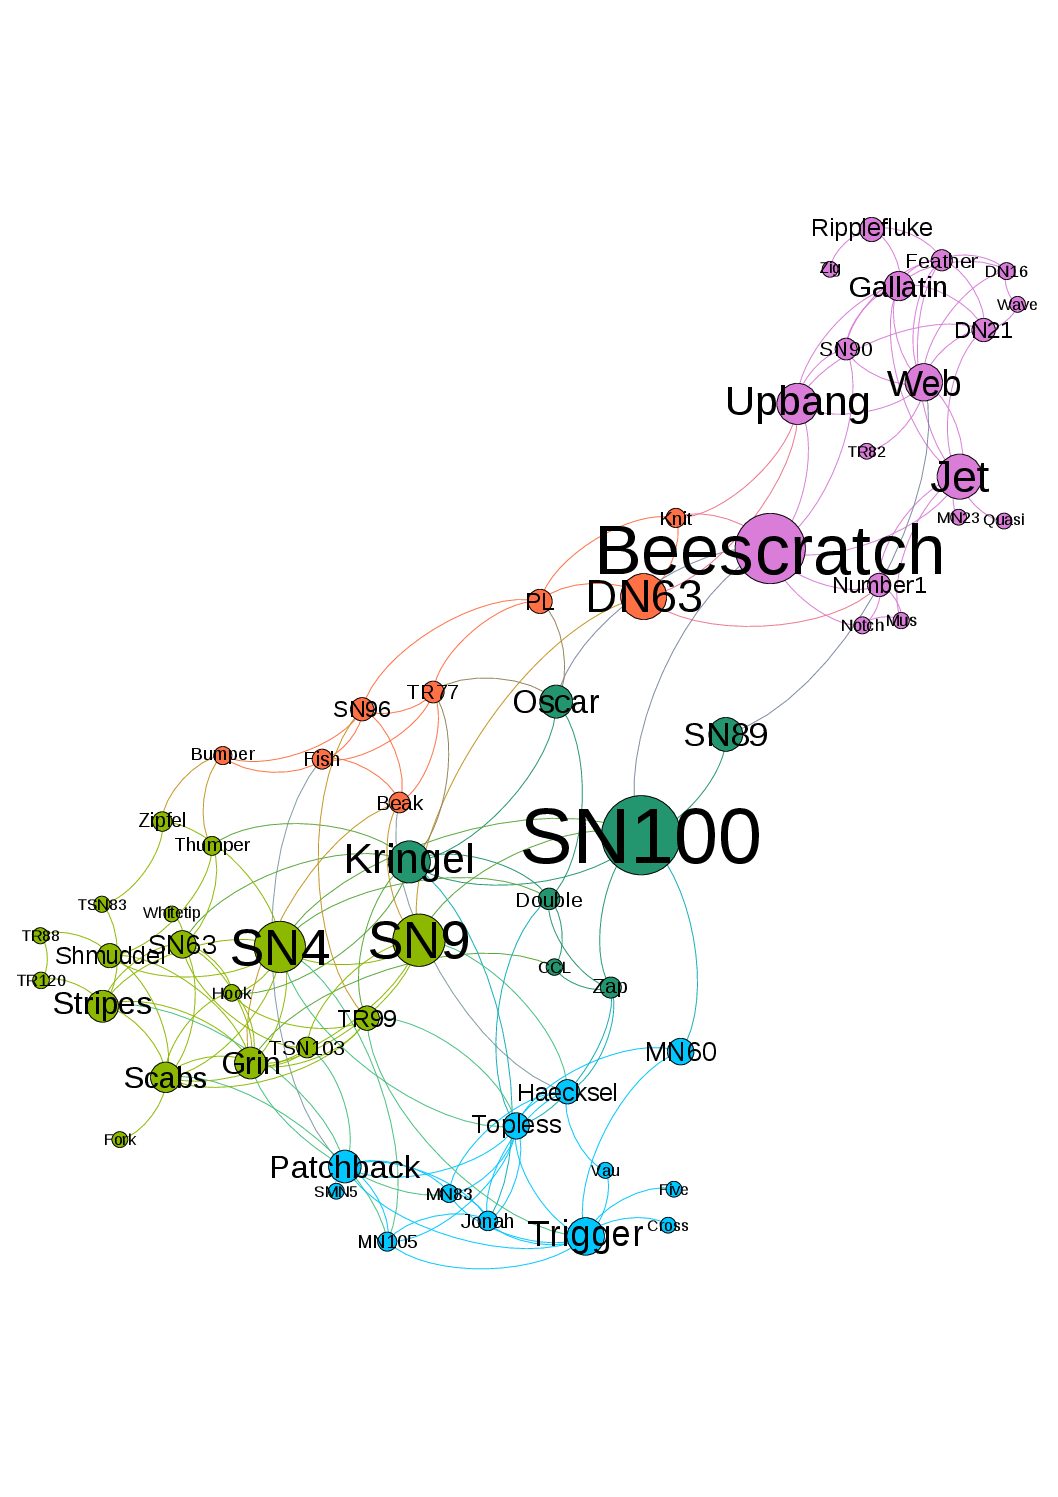
Visualizing Social Networks of of Schoolboys, Prison Inmates, and Dolphins Using Gephi

Valerie Saunders

Gephi Lab: 19th Century Social Network

hbaribea

Gephi Lab: A 19th Century The Social Network

escaglia1

Network Visualization and Analysis for the Domestic Airlines

glai2

Mapping the social structure of dolphins using Gephi

dfrank13

Gephi: Letter Exchanges Across Europe

alexvndra.ja

Visualizing Homelessness in New York City

dgallomc

A Simple Cost-Benefit Analysis of Refugee Movements

evolow

Bike Rack Distribution In New York City

Wenjun Dai

Farmers Market Directory: Where are the Organic Markets?

escaglia1

Mapping 2016 New York State Hate Crimes

Robin Miller
Map of WV Drug Deaths

Mapping West Virginia’s Opioid Crisis

heathervhill

Visualizing NYC Lower Manhattan Retailers with Carto

Elise Fu

Posts navigation

← Previous
Next →
Widgets

Topics

#Gephi #Network Visualization art bar chart carto cartodb Cartography Charts & Graphs choropleth covid-19 data visualization Data Viz final projects gender geospatial Gephi GIS history information visualization Info Viz interactive map lab report lab reports line graph map mapping maps museums network Network Analysis network graphs networks network visualization New York new york city NYC NYC Open Data openrefine QGIS social network tableau Tableau Public timeline timelinejs TimelineJS Visualization Visualization

Search

Proudly powered by WordPress | Theme: Illustratr by WordPress.com.