Walmart Locations in the US
July 18, 2022 - All
INTRODUCTION
While researching for a data set to work with, I came across many focused on Walmart. One that caught my attention was a “Walmart Projection Sales Forecast Challenge” which apparently has become popular to test data related skills. As this data set got me curious about their sales forecast, I started to do a little more research on Walmart.
Walmart has managed to monopolize the grocery store sector. It is considered to be one of the strongest supermarket chains in the US and worldwide. Every single state in the country has at least one Walmart. More importantly, Walmart is part of many peoples lives as it does not only provides all grocery and household needs, but does it at an affordable cost. Its price point offering has made Walmart one of the main choices when it comes to groceries for most households in the US.
As I became more interested in the size of Walmart, I found a data set about the chain’s size and presence in the US. I decided to use this data set to analyze and learn about the company’s size. This data set helped me to visualize how many stores are in each state of the US
MATERIAL
In order to complete this assignment I used three resources to find, clean, and sort my data:
Kaggle – Website used to access free dataset.
Excel – Used to manage and clean data set
Tableau -Used to create map visualization.
PROCESS & RESULTS
The first thing I did once I downloaded the data set was to open it in Excel to do some cleaning up. I removed any fields that were not necessary or irrelevant for the purpose of my analysis.
The data set I chose had geospatial dimensions, which means that Country, State, City and Zip Code were available so this data set allowed Tableau to present data in a map visualization.
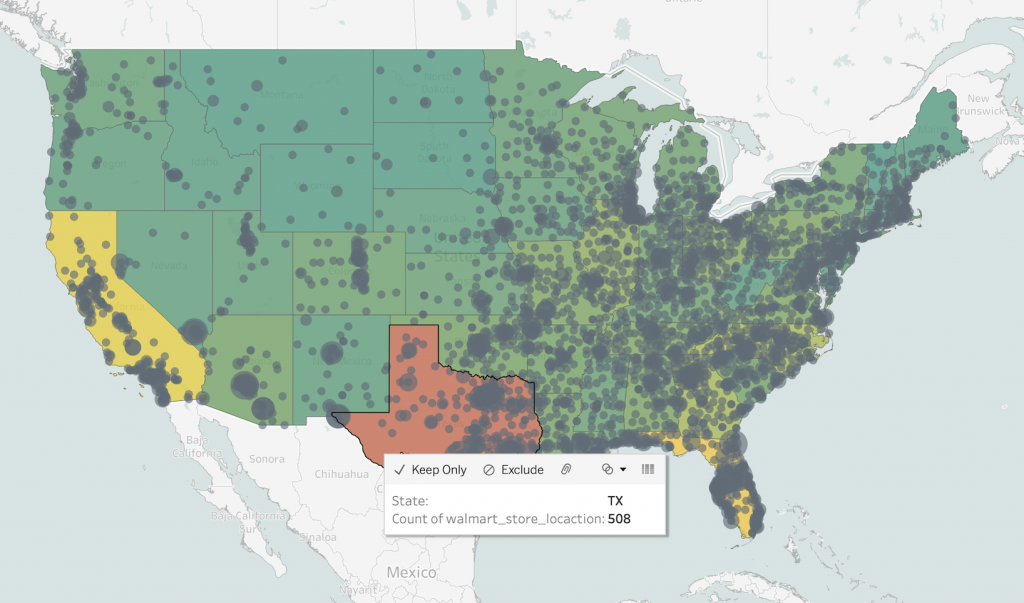
Once I uploaded my dataset to tableau, I proceeded to apply filters in order to get the information I wanted. As my goal was to sort the mapping of stores there were per state, first I created a visualization that allowed me to explore through the map the amount of stores each state had. As I wanted to further go into details, I added a filter that allowed me to navigate the amount of stores per city, as in many instances Walmart has more that one store per city.
Below figure 1.1 represents the visualization made with Tableau to identify the amount of stores each state had.
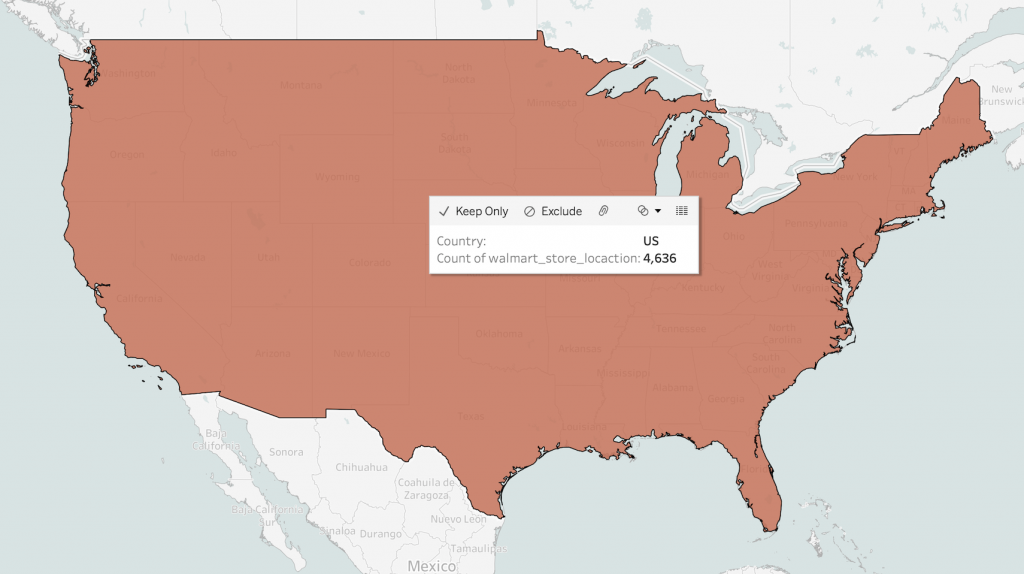
After realizing the visualization of stores per state, I thought it was also important to have a visualization that showcased the total amount of stores in the US:
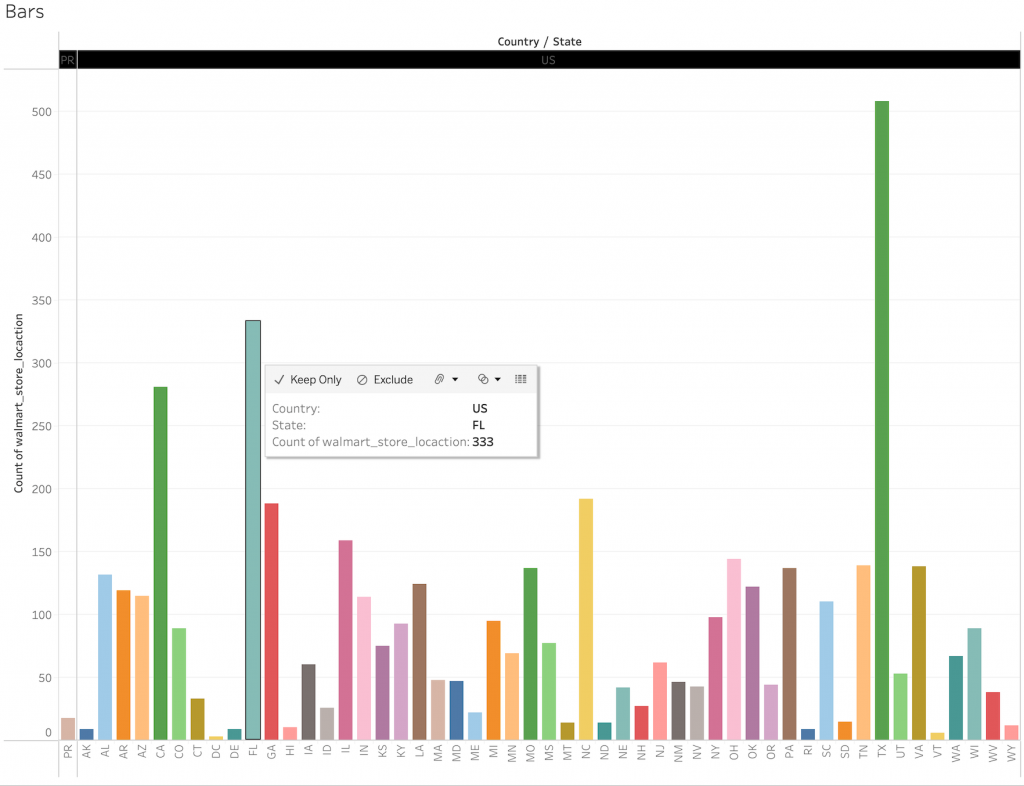
Applying color codes to the map helped visualize without the need to click on each individual state, whether the amount of stores in that state was high or low. The more intense the color, the more stores in the state. This definitely provided the viewer with a great idea, however having a bar graph would further help to identify the states with the most amount of Walmart stores. I proceed to work a bar graph representation of the information that could be found in the map:
FUTURE STEPS
If possible, I would like to pinpoint in a map the exact location of the Walmart stores, however it is not possible as in this data set I was only provided with the zip code rather than with the actual address. I would like to explore the proximity between stores located in the same city, the population size of the city, the reason behind why some cities have more than one store – in some cases within a short distance, and what defines the proximity between stores.
If possible to locate the exact location of stores I would like to create an interactive map that allows users to navigate the surrounding areas of the location and understand what other things are pithing proximity, and if the lack or overflow of grocery stores make that store to be successful.
CONCLUSION
Walmart is the largest grocery store chain in the US, it has a total of 4,636 stores in the country. With Texas, Florida and California making up nearly 25% of the total stores in the country. District of Columbia is the state with the least amount of stores, this being 3.
Tableau helped visualize a data set of over 4,500 rows which otherwise would have been complex to understand and organize. It was possible to create a map visualization as the data set I worked with had geographical information that allowed Tableau to locate stores in a map. Otherwise I would have had to create or find a different data set that provided me with this geographical information to create a map.
LINKS
Map – stores per State:
https://public.tableau.com/app/profile/maria.menendez4999/viz/WalmartUSALocations/Map
Map – stores in the US:
Bar Graph:
https://public.tableau.com/app/profile/maria.menendez4999/viz/WalmartUSALocations-BARGRAPH/Bars
Leave a Reply