
Latin American Players in Baseball
December 15, 2018 - All

INTRODUCTION
For over a century, Baseball has been one of the major sports in America. In the past 70 years though, we have seen that sport evolve with stricter rules and team with players from all over the world. These player have been some of the most leading names in baseball such as Roberto Clemente from Puerto Rico, José Abreu from Cuba, and more recently Shōhei Ohtani from Japan who just won Rookie of the Year. With 162 games each season these players become household names among their teams fan bases, inviting these players into their homes on their televisions or going to pay them a visit at their favorite park.
To build these teams, not only is there a lot competition to get the best players but there are certain rules that have to be followed. For many players, namely players from the United States and Canada, the first year draft or the June draft as it is often referred to is the gateway to getting their foot into a Major League Baseball contract. As of 1989, the first year draft also includes players from Puerto Rico. The first year draft, however is heavily regulated and has multiple rules in place that prevents many players from being drafted before they turn 21 and over the years these rules have become much more strict and enforced.
However for players that are not from the United States, Canada, or now Puerto Rico, a different set of rules and condition apply to recurring those players. Though for each country certain rules and regulations apply. For example with Asian players the are multiple rules which sometimes includes paying off the club that the player is currently apart of at the time of the deal. With Latin American players, the only real rule is no underage players though many teams do scout younger than that, putting those players in baseball academies where they start their training as well as move them out of the eyes of other teams. Due to the lack of restrictions placed on these players there have been numerous reports of how these players are exploited dating all the way back to the 2000’s.
While there have been many articles pointing out how these players were being exploited, including one player, Yasiel Puig coming out and sharing his story it was only in October of 2018 that the Department of Justice started to investigate these accusations. As of right now, December 2018, the Department of Justice is currently looking into the Atlanta Braves and the Los Angeles Dodgers over claims of human trafficking.
Goals
This project had the following goals
- Explore the amount of player from Latin American countries that have been recruited over the past century and see how that has changed over time.
- Explore the teams that own these players and view who they are recruiting and from where.
METHODS
Materials
- Baseball Reference – Baseball Reference is a site that has infinite amounts of data that they allow to be copied in a CSV format. For this project Baseball Reference served as an invaluable resource to find data.
- Tableau Public – Tableau Public is a free program that is used for creating data visualizations. All visualizations for this project have been created using this program.
- Google Sheets – Google Sheets were used to store the information created from this project.
- Merge Sheets – Combine Sheets is a trial add-on for Google Sheets that allows combining information from two separate sheets using like columns.
Gathering the Data
Gathering the data for this project was a bit more of an undertaking than I originally expected. Thanks to the many great baseball fans who have a great passion for statistics there are many different places to find datasets. What became a challenge was trying to figure out what data I needed and what data I did not need. In order to make this information useful to causal fans I knew I did not want a lot of player statistics that could be interesting to the more advanced fan. In the end I decided the best data for this project, at least of the sets I was able to find, were debut data and birth data by country. The debut data included information on which team each player made their start from since I was unable to find complete draft information. With the debut data I was able to combine it with the birth data by country which contained information such as birth place, years played, as well as much more information that was less relevant to the goals of this project. Thankfully all this information was provided freely from Baseball Reference, which made the two sets easy to join together to create one sheet.
Putting It All Together
In order to best articulate these goals through visualization Tableau was used to create three different graphs regarding the topic. Tableau was the most logical choice to help shape the graphs. Due to its user friendly capability and high level of customization abilities it was the simplest program to input large spreadsheets into with the ability preform guess and check with the large amount of players that were being examined. The first graph I knew that I wanted to make would be a line graph to track the trends of debuts over the past few years. Once that graph had been made I was able to get a better idea of what had been happening over the past few decades and had a better idea of how to explore this topic as well as where I wanted to go with my idea.
UX Study
One of the most important factors to take into account when building this product was the knowledge level of the users. Baseball, as with most sports, have fans ranging from very casual to extremely knowledgeable and the goal was to create a tool that would be useful for a wide variety of users with just a basic knowledge of the sport. In order to test the visualization out, I asked users on various baseball Reddit’s to test my product. In the end I received five volunteers who helped shape the visualizations provided.
For my UX Study I thought it would be best to do an interview chat study that lasted between three and five minutes on discord. Before the interview I sent out a rough visualization of what I had and allowed them to freely explore the product so they would have a bit of an understanding of where I was coming from as well as to allow them to give feedback on potential areas to go from there. After they explored the prototype I asked them some of the following questions that were both related to the topic as well as the visualization.
- Did you understand what you were looking at?
- What was the first thing you noticed when looking at the visualization?
- Was there anything that took you awhile to fully see/understand?
- What is your level of baseball knowledge?
- Did you learn anything by looking at these visuals?
- By looking at these graphs what do you think the main idea of this story was?
I was lucky enough to get some great feedback in my UX study that helped build my design. Some examples of feedback I got included certain legends of graphs not standing out, colors such as my country colors being too dull, and not enough information being shown on the tree map.
VISUALIZATIONS
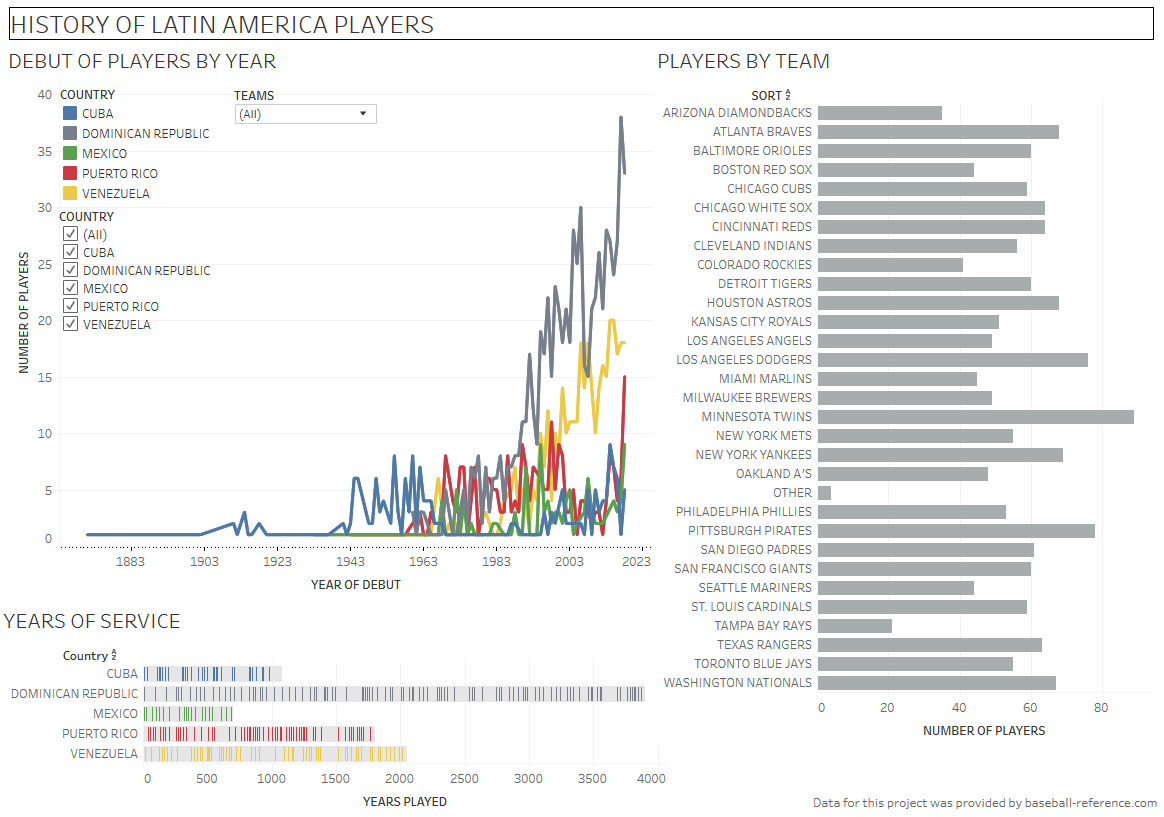
Fig. 1
After feedback provided by my fellow classmates, I changed the layout of the graphs from a story mode with tabs to a complete dashboard. By transfiguring the dashboard I was able to align all the information onto one page without losing the impact of the main graph. The biggest perk of creating a dashboard is that the filters permeate throughout all the graphs meaning that by checking off one team or country will filter the rest of the graph.
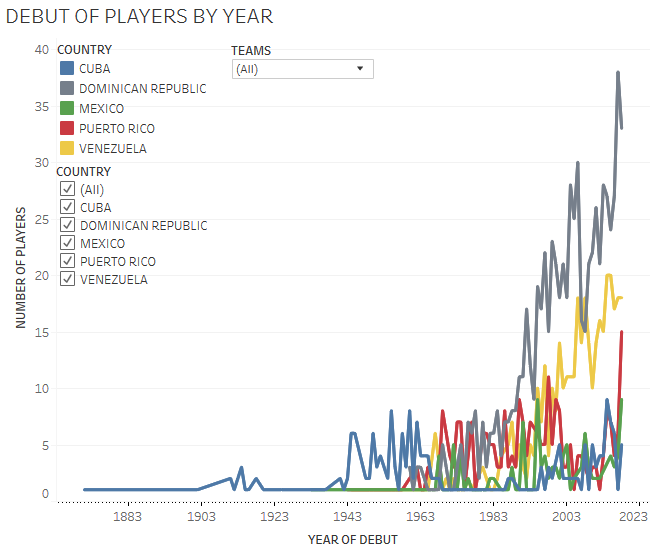
Fig. 2
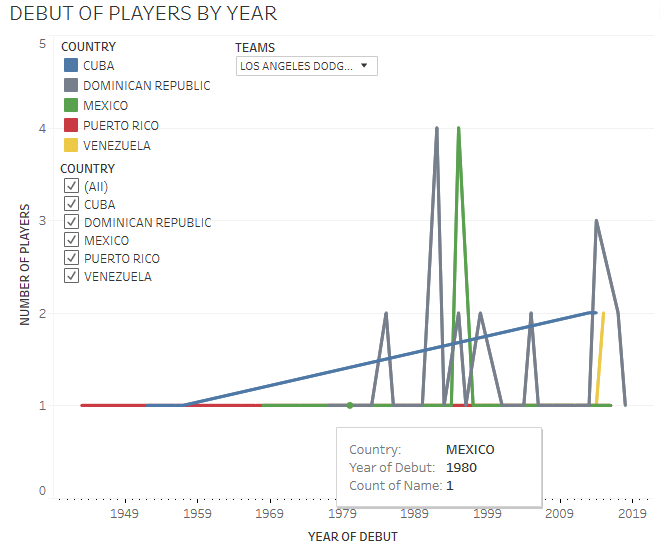
Fig. 3
The first main graphic titled “DEBUT OF PLAYERS BY YEAR”, shows how many players from each country made their major league debut in each year. In the first rendition of this graph the countries were much more muted colors which proved to mix together when the colors got too tangled according to the user studies. After that feedback I changed the colors to more bold colors to stand out against each other. This graph is able to be filtered by either country, team, or both. Upon hover it is possible to see the country of the line as well as the exact year at that point.
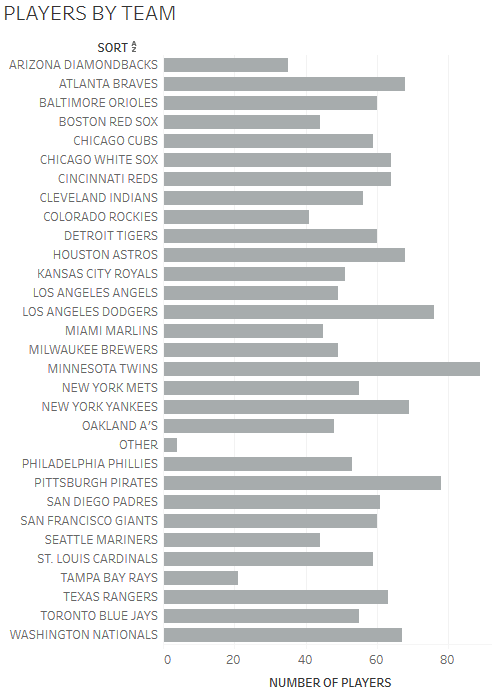
Fig. 4
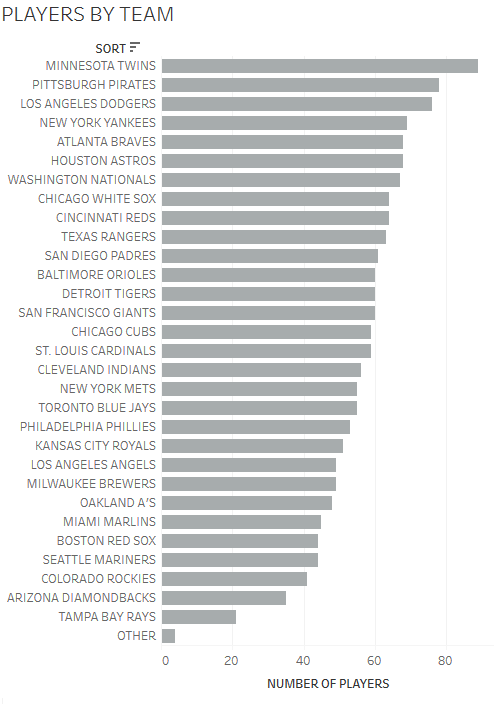
Fig. 6
The next portion of the dashboard is the “PLAYERS BY TEAM” bar graph. As with the previous graph the same filters allow for the graph to be sorted by focused by team and country, in multiple forms if chosen. In addition to the filters, the graph can be sorted numerically as well as alphabetically if looking for a certain team by using the sort button at the top of the graph. It is important to note with these teams, they are currently grouped by franchise, keeping together teams that have moved or changed names such as the Brooklyn Dodgers and the Los Angeles Dodgers are all located under the current name. The “OTHER” category are teams that are no longer in existence.
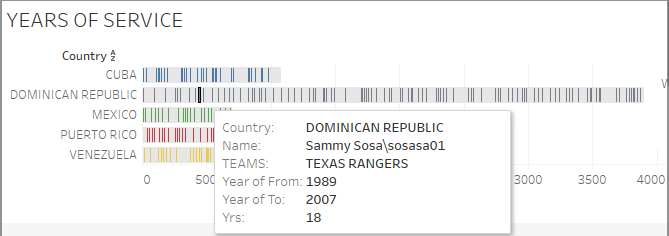
Fig. 7
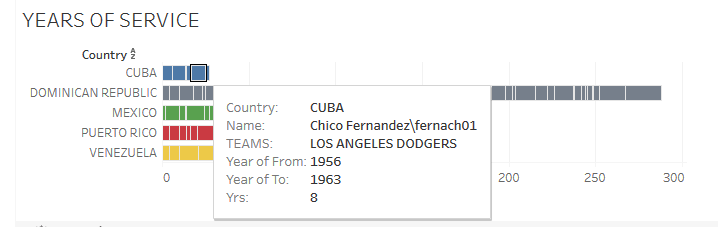
Fig. 8
The last part of the graph titled “YEARS OF SERVICE” was designed to understand how long these players last in the league. I was curious to see if they players have a high turn overrate and I was surprised at how long these players are part of the Major League overall. The marks on this graph seem faint as see in Fig 7 but that is because they show marks for the individual players, the longer their square on the stacked bar the longer they were in the league. If filtered by team as seen in Fig. 8 it is easier to see the individual marks on the chart.
In addition to understanding how these players have a lasting affect in the league, this also serves as a database to actual see the players making up this team. In this stacked bar chart it is possible on hover to see the Country these players played for, the players name, what team they debuted with, what year they started, what year they played till, and how many years total they played in the Major League.
Findings
The first thing that truly stood out when looking at the data is on the “DEBUT OF PLAYERS BY YEAR” graph it was easy to see how while Puerto Rico became nearly stagnant countries like Mexico and Venezuela seemed to rise after 1989. Not only did they rise in 1989 but both countries still are still on the rise according to the chart. In 2018 Venezuela had 18 players make their debut and the Dominican Republic had nearly twice as much at 33 players. With the line graph it is easy to see the trend of these countries and how stagnant other countries are compared to them.
With what we know about the Department of Justice investigations that are currently happening it was very interesting to look at teams like the Atlanta Braves and the Los Angeles Dodgers and see information regarding those teams. When sorting the Latin America players by count on the second chart it was interesting to see both teams made the top 5 teams with the most debuts in 3rd and 5th place. Also in the top 5 of teams with the most debut were the Minnesota Twins, Pittsburgh Pirates, and the New York Yankees. In addition it was also interesting to see how filtering countries changed these top 5 such as the San Diego Padres being top for players born in Mexico.
RECOMMENDATIONS
If I were to continue working on this project which I hope to continue to do, there is a lot more information that I would like to find in order to make these results a clearer picture such as the following:
- Draft information on all players from all countries – While I do feel like this is a good snapshot of information, with complete draft data will normalize some of the information and put it in perspective with the other information that has been provided in this project.
- Team spending – Though this is not something I know will aid in this process but it could lead to some interesting information such as which players are getting higher signing bonus and which teams seem to be putting money into newer recruits rather than drafting veteran players.
- Agent data – Outside of the complete draft data this could be a very interesting path for this project to take. It would be interesting to see which players share recruiters and how that affects which teams are recurring what players from which countries.
BIB
Baseball’s Exploitation of Latin Talent
What we know about the Department of Justice’s MLB investigation
The post Latin American Players in Baseball appeared first on Information Visualization.